Security hotspots
A security hotspot highlights a security-sensitive piece of code that the developer needs to review. Upon review, you'll either find there is no threat or you need to apply a fix to secure the code. For more information about Security Hotspots, take a look at the SonarQube Server, SonarQube Cloud, and SonarQube Community Build documentation.
Hotspot analysis
In SonarQube for IntelliJ, local detection of Security Hotspots is enabled if you are using Connected Mode with a project on SonarQube Server 9.7+ or SonarQube Cloud.
Reviewing hotspots
First, open a file while your project is running in Connected Mode with SonarQube Server, SonarQube Cloud, or SonarQube Community Build. SonarQube for IDE will automatically run an analysis to look for security hotspots, then compare local results against those on the server.
All security hotspot results are presented in the Security Hotspots tab of the SonarQube for IDE view window. Detected hotspots will be categorized by High, Medium, or Low review priority as noted by their icon. Hotspots found locally that are matched to those found on the server are identified by an additional SonarQube (Server, Cloud) icon. There is a filter in the left sidebar to Show All, show Local Only, or show only hotspots Existing on SonarQube Server or SonarQube Cloud.
As with all issues found by SonarQube for IDE, double-clicking an issue in the SonarQube for IDE view window highlights the code in the code editor. Selecting a hotspot will automatically open the rule description where you have a chance to investigate further.
Ways to find hotspots
With SonarQube for IntelliJ, it is possible to analyze and detect security hotspots in all project files:
- Select the Analyze All Project Files icon in the Report tab.
- Select the Analyze VCS Changed Files icon to analyze files changed since the last commit.
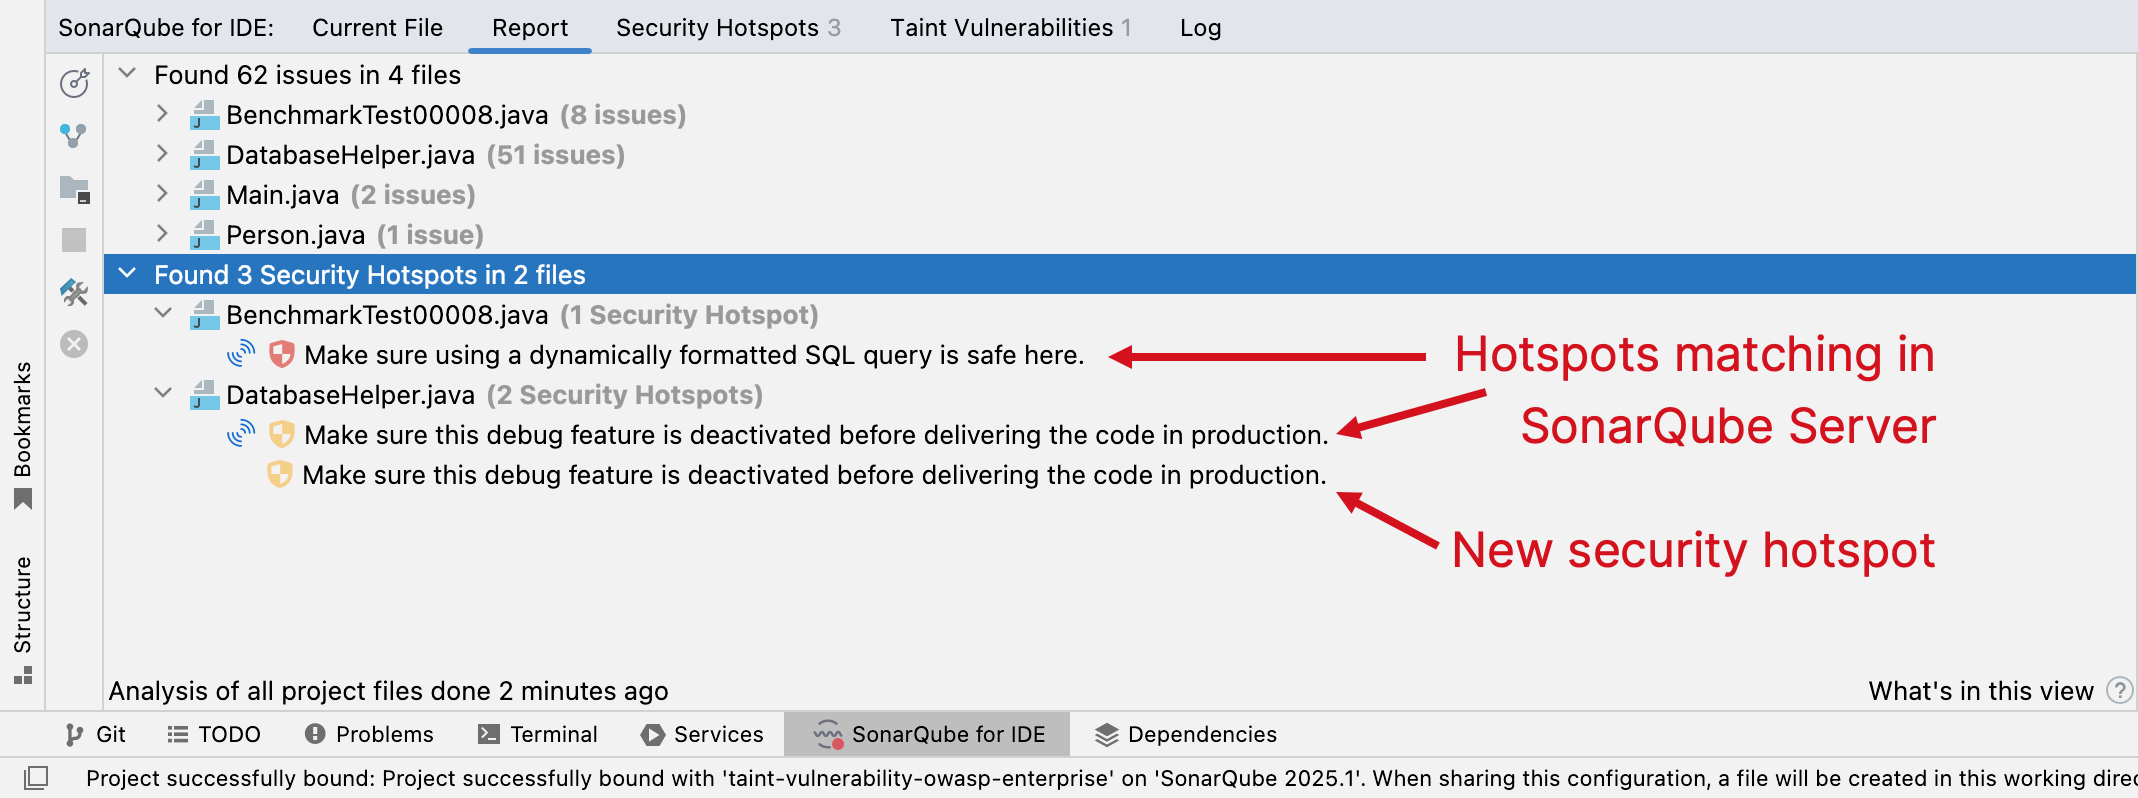
- Right-click on a selection of files in the explorer window and select SonarQube for IDE > Analyze with SonarQube for IDE to populate issues in the Report tab for review. In the Report tab, security hotspots are displayed separately from regular issues and are grouped by file.

Investigating hotspots

New hotspots
New security hotspots are those not yet detected by a SonarQube (Server, Cloud) analysis and have only one hotspot icon that identifies the hotspot's review priority. These hotspots can be fixed by modifying the code or submitting your code to trigger a new analysis on the server-side.
Matching hotspots in SonarQube Server
After each local analysis is complete, SonarQube for IDE compares the local results against those found on the SonarQube (Server, Cloud) server; hotspots found in both places will have an additional SonarQube (Server, Cloud) icon. Once synced with the server, you can mark the security hotspot as Safe or Fixed in the IDE; see the next section, Fixing hotspots, for more details.
Marking the hotspot as Safe or Fixed on the server and re-running a local analysis will update the review status in the IDE.
If you prefer to manage the security hotspot on the server, right-click on the hotspot and select Open in SonarQube Server or SonarQube Cloud; the hotspot will open in your default browser. Don’t forget that there’s a filter in the left sidebar of the Security Hotspots view to help you sort hotspots.
Fixing hotspots
How you fix a security hotspot depends on your assessment of the risk. Check the Rule description and the How can I fix it? tab to find recommended secure coding practices and compliant solutions (when available). More information can be found in the SonarQube Server, SonarQube Cloud, and SonarQube Community Build documentation.
Once you determine the risk, you can either update your code locally or, if the hotspot matches one found on the server, change the hotspot’s review status in the IDE. The prerequisites to change the review status in the IDE are:
- The security hotspot detected locally is already known by SonarQube (Server, Cloud).
- You are granted the Administer Security Hotspot permission level by a project administrator.
Simply select the hotspot in either the Report or Security Hotspots view window to open its Rule Description. In the Rule tab, select the Change Status button to open a dialog box where you can mark review status in the IDE from To Review to Fixed, or Safe.
Was this page helpful?