Running an analysis
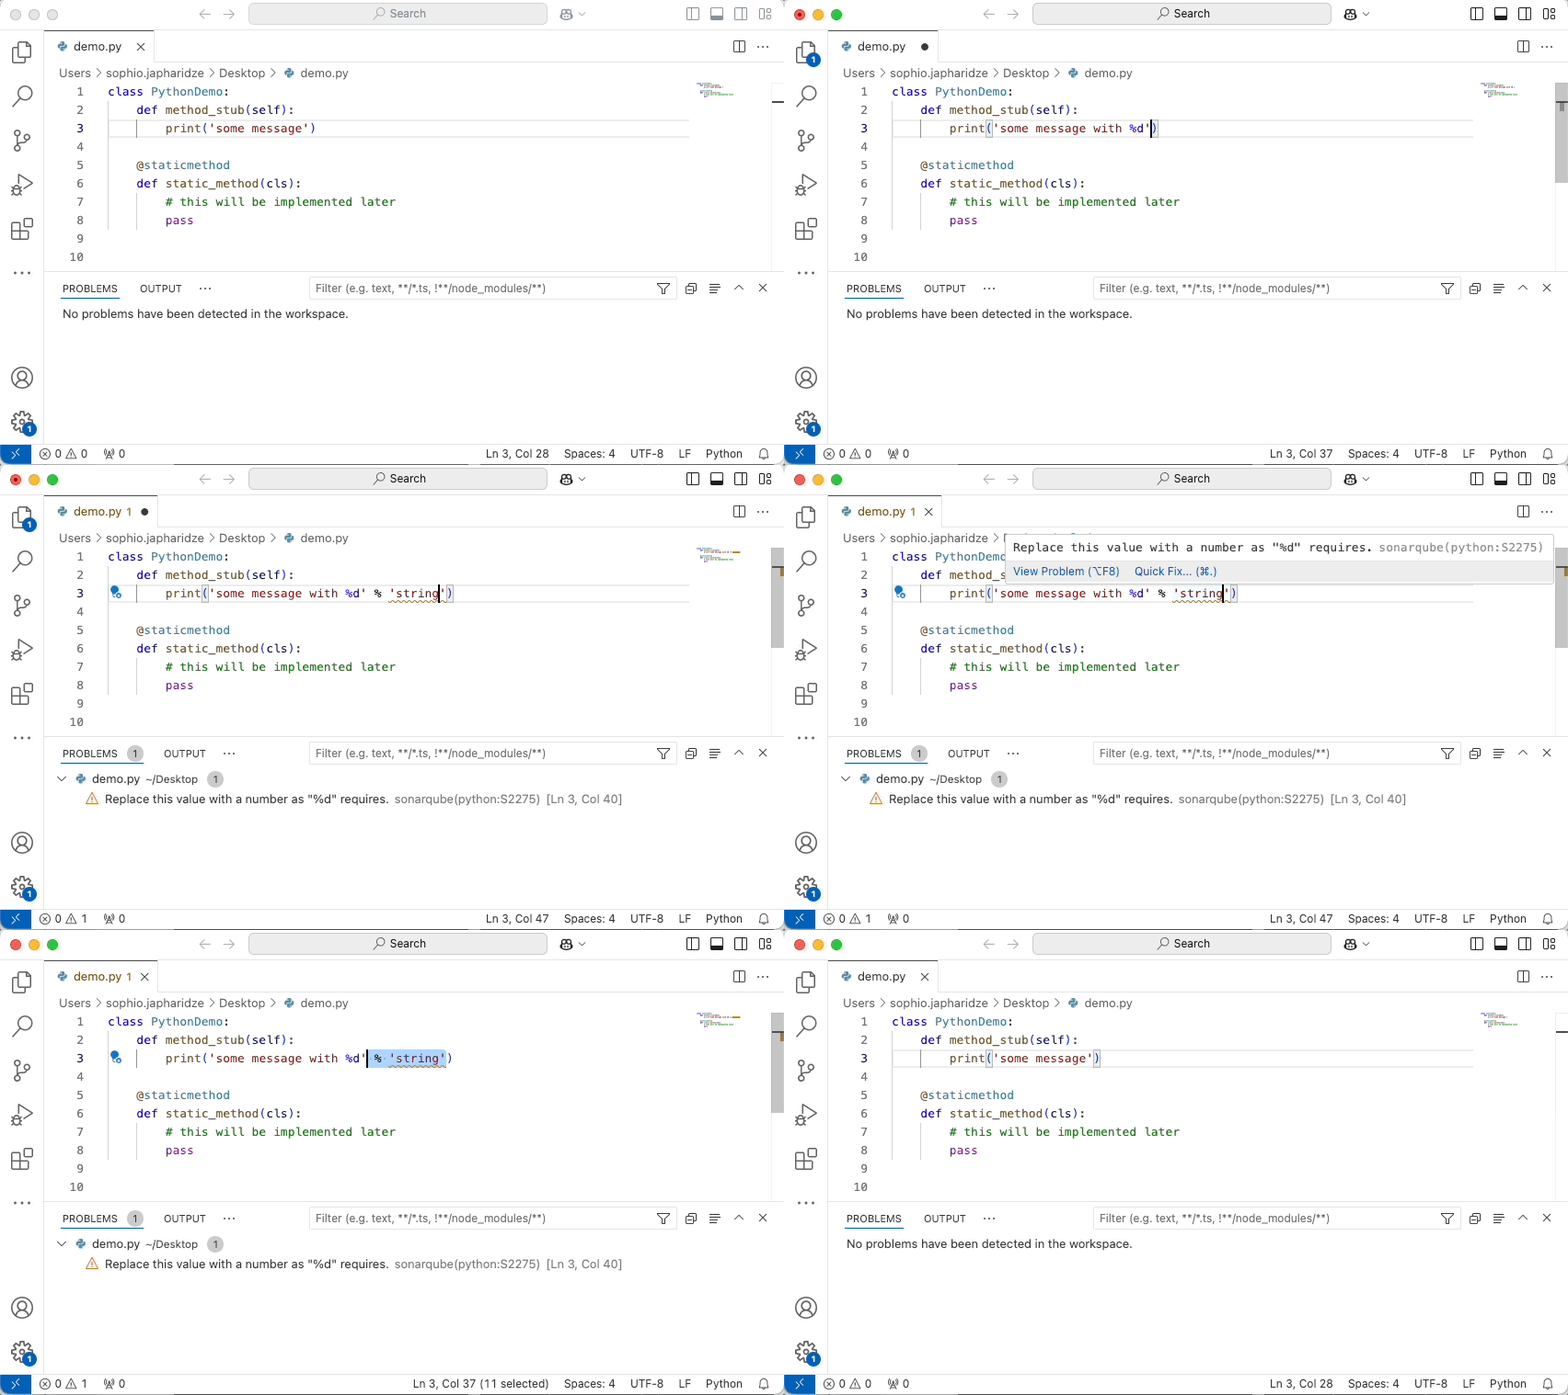
Now that you've installed the SonarQube for IDE extension in your IDE, running an analysis is straight-forward. For the most part, new analyses are automatically triggered when you open a file, as you type, or with each file save following a change in the code. Below we've outlined other ways to trigger a SonarQube for IDE analysis.
Triggering an analysis
First, open a project using one of the supported languages. Some languages can only be unlocked when running in Connected mode. For C and C++, check the Analyze C and C++ code section below.
New analyses are automatically triggered in VS Code when you open or save a file; with Autosave configured, new issues will be reported as you type.
Check the Investigating issues page for details about how to recognize issues in your IDE.
How it works
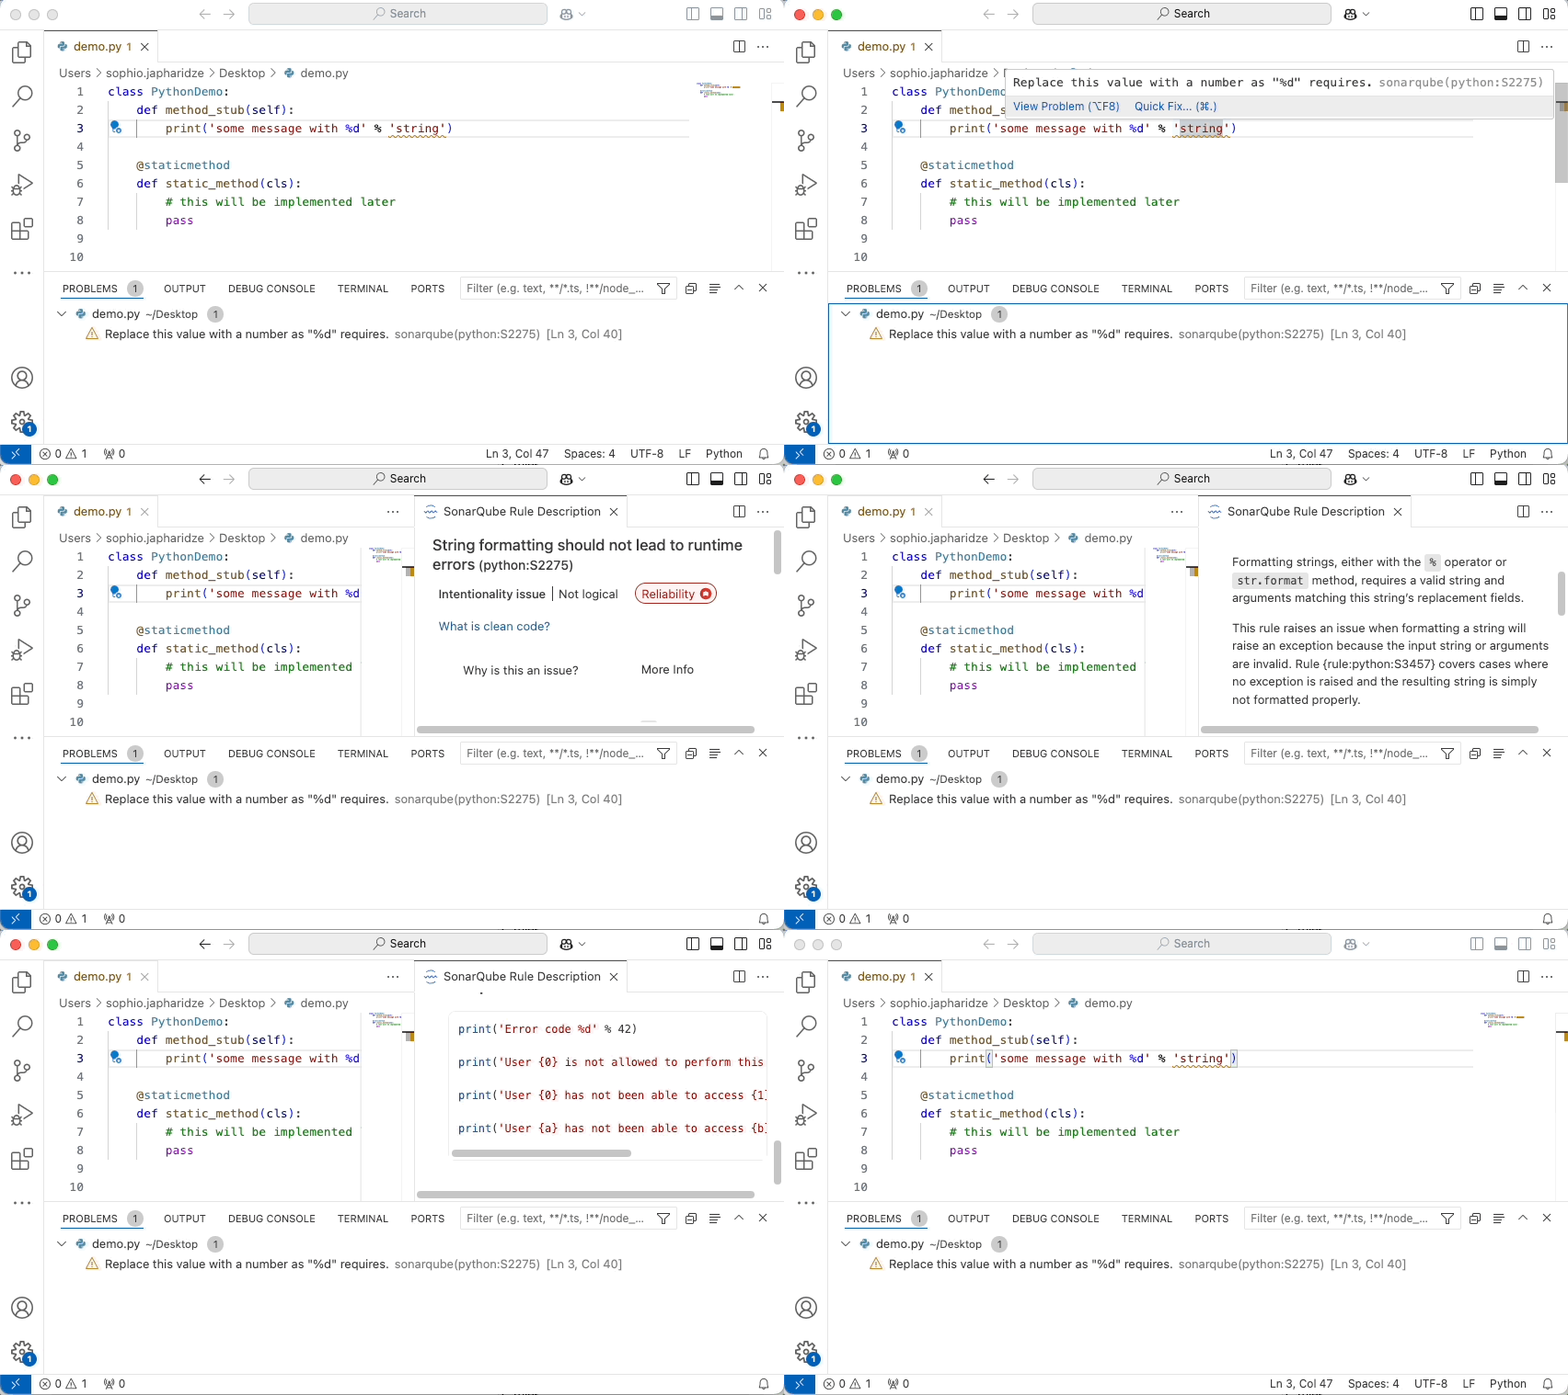
With Auto Save enabled in VS Code, SonarQube for IDE continuously analyzes the code while you type. Simply open any source file, start coding, and you will start seeing issues reported by SonarQube for IDE. Issues are highlighted in your code and also listed in the PROBLEMS panel.

You can access the detailed rule description directly from your editor, using the provided contextual menu.

Analyze C and C++ code
Prerequisites
To analyze C and C++ code, you need to satisfy both of these conditions:
- Generate a compilation database and
- be on one of the Supported environments
See below for details.
Generate a compilation database
Compilation database is a JSON file format introduced by the LLVM project. It contains the compile commands used to build a project. For instructions on how to generate a compilation database, choose the appropriate collapsible below. The preferred option is to use the build system.
The C and C++ ecosystem is diverse. This documentation provides a general overview of how to set up your environment under common circumstances. If you need more assistance than we can provide here, please check if the compilation database is a feature in your extension, search the SonarQube for VS Code Community forum for details about your build system, and reach out with questions if you have any troubles.
Using the build system
Generate a compilation database using the build system
Many build systems support the automatic generation of compilation databases. For example:
- CMake by simply setting this option
CMAKE_EXPORT_COMPILE_COMMANDS - VS Code Makefile Tools extension
- Ninja by setting the
compdbflag - Xcode through Clang's
-gen-cdb-fragment-pathfeature:
# Add the following "OTHER_CFLAGS" option to the xcodebuild command
xcodebuild clean build <additional args> OTHER_CFLAGS="\$(inherited) -gen-cdb-fragment-path \$(PROJECT_DIR)/CompilationDatabase"
# After the build, aggregate the fragments into "compile_commands.json"
cd CompilationDatabase && sed -e '1s/^/[\'$'\n''/' -e '$s/,$/\'$'\n'']/' *.json > ../compile_commands.json && cd ..- Clang using the -MJ option. Note that this will generate a compilation database entry by input. The merge of all entries can be done through something like
sed -e '1s/^/[\'$'\n''/' -e '$s/,$/\'$'\n'']/' *.o.json > compile_commands.json
When different choices are available, generating a compilation database through the build system should be preferred.
Using Sonar's Build Wrapper
Build Wrapper is a tool developed by Sonar that generates a compilation database, capturing your build configuration at build time. To run Build Wrapper, you should prepend your clean build command with the Build Wrapper executable.
When you wrap your build command with the build wrapper, it will run the given command and gather all the configuration required for a correct analysis of C/C++/Objective-C projects such as macro definitions and include directories. The Build Wrapper does not impact your build; it merely monitors it and writes what it learns into files in a directory you specify. There is no need to build a second time without Build Wrapper.
You should download the build wrapper directly from SonarQube Cloud:
- Download Build Wrapper for Linux
- Download Build Wrapper for macOS
- Download Build Wrapper for Windows
Unzip the downloaded build wrapper and configure it in your PATH because doing so is just more convenient.
Execute build wrapper as a prefix to your usual clean build command. A clean build command should always build the project from scratch.
The examples below use make, xcodebuild and MSBuild, but any build tool that performs a full build can be used:
Linux
build-wrapper-linux-x86-64 --out-dir build_wrapper_output_directory make clean allmacOS
build-wrapper-macosx-x86 --out-dir build_wrapper_output_directory xcodebuild clean buildWindows
build-wrapper-win-x86-64.exe --out-dir build_wrapper_output_directory MSBuild.exe /t:Rebuild /nodeReuse:FalseAt the end of your build, a compile_commands.json file should be generated in the specified output directory.
All the files generated by Build Wrapper in the output directory contain a dump of the environment. Sharing these files, in some contexts, can be a security concern.
Using open-source wrappers
Generate a compilation database using open-source wrappers
In case the above options are not successful in generating a compilation database, some open-source wrappers can help. For example:
Using a custom script
Generate a compilation database using a custom script
A compilation database is simply a JSON file that describes how to compile a project. If none of the previous approaches are feasible, for example, in the case of an internal build system, writing a script that generates a compilation database to describe how source files are supposed to be compiled might be the best solution.
Best practices
- Make sure that the compilation database contains the actual compile commands. This can be checked by running the compilation commands inside the
compile_commands.jsonand verifying that they succeed. - The compilation database should not contain header files entries. We use internal heuristics to analyze header files
- Make sure that the compilation database is up to date. It should be refreshed as part of the development cycle.
If you don’t use the Build Wrapper to generate a compilation database and the build relies on environment variables, make sure that they are set in the VS Code environment.
General recommendations
Best practices
- Make sure that the compilation database contains the actual compile commands. This can be checked by running the compilation commands inside the
compile_commands.jsonand verifying that they succeed - Make sure that the compilation database is up to date. It should be refreshed as part of the development cycle
- If the build system uses environment variables, make sure that they are set in the VS Code environment
- The compilation database should not contain header files entries. We use internal heuristics to analyze header files
Supported environments
Compilers
Supported compilers
- Any version of Clang, GCC, and Microsoft C/C++ compilers
- Any version of Intel compiler for Linux and macOS
- ARM5 and ARM6 compilers
- IAR compilers for ARM, Atmel AVR32, Atmel AVR, Renesas H8, Renesas RL78, Renesas RX, Renesas V850, Texas Instruments MSP430, and 8051
- QNX compilers
- Texas Instruments compilers on Windows and macOS for ARM, C2000, C6000, C7000, MSP430, and PRU
- Wind River Diab and GCC compilers
- Compilers based wholly on GCC, including, for instance, Linaro GCC, are also supported
Language standards
Supported language standards
C standards: C89, C99, C11, C17
C++ standards: C++03, C++11, C++14, C++17, C++20 and C++23.
GNU extensions
Runtime environments
Supported runtime environments
- Microsoft Windows on x86-64
- Linux on x86-64
- macOS with version 10.14.3 and later on x86-64
Activating C and C++ Analysis
The analysis can be activated by simply pointing to a compilation database that describes the project to be analyzed. This can be done through a notification that pops up when a folder that contains a file named compile_commands.json is opened, or through the SonarQube for VS Code embedded action that lists all compilation database files in the folder, or by manually assigning the sonarlint.pathToCompileCommands option in the settings to the full path of the compilation database.
Note that the SonarQube for IDE embedded action can be used to switch the active compilation database.
Troubleshooting C and C++ Analysis
In case the analysis is not working or obvious false positives are raised, here are the recommended actions in order:
1. Investigate the logs:
- First, enable the
Analyzer Logsand look if there is any error or failures that indicate what went wrong. - If there is no obvious sign in the logs, enable
Verbose Logsand check again. - Check the Troubleshooting page for instructions to enable these logs.
2. Make sure that the compilation database is credible:
- Check that the compilation database is up to date. It shouldn't contain outdated commands or point to files that no longer exist.
- Make sure that the compilation database contains the actual compilation commands. This can be done by running the
commandsinside thecompile_commands.jsonand verifying that they succeed. - Make sure that the VS Code environment has the environment variables required to build the project.
3. Enable Rule `S2260`:
- In case of obvious false positives in the raised issues, enable the
cpp:S2260orc:S2260rule and check if it raises issues in the culprit file. This rule indicates that the analyzer failed to parse part of the code and might give hints or indicate a configuration problem. - If it raises issues, follow the rule description to fix your code; if not, move to the step in troubleshooting.
4. Generate the CFamily reproducer File and Report the Issue:
- When none of the previous suggestions work, please report the problem you encountered in the Sonar Community.
- In case of a false positive or an analysis failure, we need the CFamily reproducer file to investigate the issue. To generate the reproducer file, add the following analyzer option to the
settings.json:"sonarlint.analyzerProperties": {"sonar.cfamily.reproducer" : "C:\\replace\\by\\path\\to\\file.cpp"}
- The
sonar.cfamily.reproducershould point to the source or header file on which you face the issue. After setting that option, trigger the analysis on the culprit file. You should see in the logs that a file namesonar-cfamily.reproduceris generated in a temporary directory. Upload that file in your community report or ask us to share it privately if it contains sensitive information.
Was this page helpful?