Setting up the monitoring with the Prometheus server
This section explains how to use SonarQube's native integration with Prometheus to collect Prometheus metrics in a Kubernetes deployment. To set up the monitoring, follow the steps described below. We refer here to a setup using the Prometheus Operator which requires the PodMonitor to collect the metrics.
Introduction
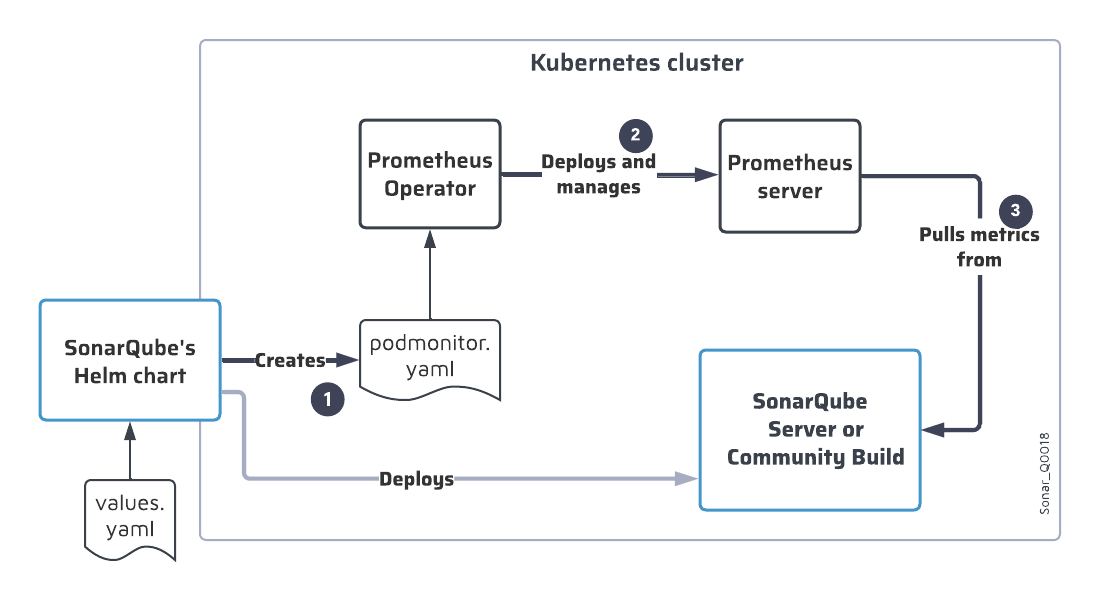
The SonarQube Community Build’s Helm chart triggers the deployment of a Prometheus server that will pull the metrics from the SonarQube Community Build instance. The deployment process is as follows:
- When you install the SonarQube Community Build’s Helm chart in the Kubernetes cluster, the chart creates a PodMonitor resource (
podmonitor.yaml), which configures the pulling of metrics from SonarQube Community Build. - The Prometheus operator deploys a Prometheus server based on the created PodMonitor resource.
- The Prometheus server will pull the metrics from SonarQube Community Build according to the PodMonitor configuration. To pull the metrics from the Web API endpoint, it needs to authenticate to the Web API. (The Helm chart sets up the PodMonitor to use the Bearer authentication scheme.)
The figure below illustrates this process.

Step 1: Set up the Prometheus server authentication to the Web API's monitoring endpoint
The PodMonitor needs to authenticate to the SonarQube Community Build’s Web API for getting metrics from the /api/monitoring/metrics endpoint. To setup this authentication, you must define the monitoring password in values.yaml: the Helm chart will store this value in the SONAR_WEB_SYSTEMPASSCODE environment variable on SonarQube Community Build.
To set the monitoring passcode in SonarQube Community Build, use one of the following methods (see also the Helm chart documentation):
- Define the passcode in the
monitoringPasscodeproperty within thevalues.yamlfile (default value is “define_it”).
For security reasons, this method is not recommended. - Use a secret that contains the passcode that will be retrieved at runtime, and define the following properties in
values.yaml:monitoringPasscodeSecretName: name of the secret object.monitoringPasscodeSecretKey: key identifying the passcode to be extracted from the secret object.
Step 2: Enable the export of the JMX metrics
To expose the Prometheus JMX metrics, the JMX exporter must be enabled in the Helm chart configuration as follows:
- Add the following block in the
values.yamlfile of the SonarQube Community Build Helm chart:
prometheusExporter:
enabled: true
config:
rules:
- pattern: ".*"Step 3: Enable the PodMonitor
- If not already done, install the Prometheus Operator in the Kubernetes cluster (it's not installed through the Helm chart).
- In the SonarQube Helm chart, enable the PodMonitor by setting
prometheusMonitoring.podMonitor.enabledtotrue. - If necessary, adjust the PodMonitor created by default by the SonarQube Helm chart. Below is the default
podmonitor.yamlfile.
To adjust the PodMonitor:- Either edit the Helm chart.
For more information, see Prometheus PodMonitor in the Helm chart documentation. - Or edit the created
podmonitor.yamlfile directly.
- Either edit the Helm chart.
Default PodMonitor
apiVersion: monitoring.coreos.com/v1
kind: PodMonitor
metadata:
  name: sonarqube
  namespace: monitoring
spec:
  namespaceSelector:
    matchNames:
    - sonarqube
  podMetricsEndpoints:
  - interval: 30s
    path: /
    scheme: http
    targetPort: monitoring-ce
  - interval: 30s
    path: /
    scheme: http
    targetPort: monitoring-web
  selector:
    matchLabels:
      app: sonarqube
Step 4: Set up the export of the metrics to an observability platform
See the List of Prometheus metrics.
Related pages
Was this page helpful?