Investigating issues
SonarQube for IDE can help developers by letting them perform local analyses to check their code before pushing it back to the SCM. While running an analysis, SonarQube for IDE raises an issue every time a piece of code breaks a coding rule.
Usually, a first analysis is performed as soon as one of the supported files is opened. Then, regular analyses are triggered when the editor content changes and/or when the file is saved.
This page describes how to find and investigate issues in your IDE.
Defining issues
An issue is a problem in your code that violates one of the Sonar rules. Issues found in code are linked to coding attributes and software qualities that determine the overall severity of an issue. Software qualities determine the overall severity of an issue that feeds back into the overall status of your code; please see the SonarQube Server or SonarQube Cloud documentation for more information about quality standards and new code.
Each issue is linked to one coding attribute which is associated with one or more software qualities; each software quality has a level of severity. See Software qualities for more information.
To communicate the code attributes, software qualities, and severity of issues found in your code, SonarQube for Eclipse displays them in the SonarQube Rule Description view as described below.
Finding issues
Issues are displayed by SonarQube for Eclipse in 2 places:
- In the Eclipse Text Editor, identifiable by the classic squiggles underlining issues in the code.
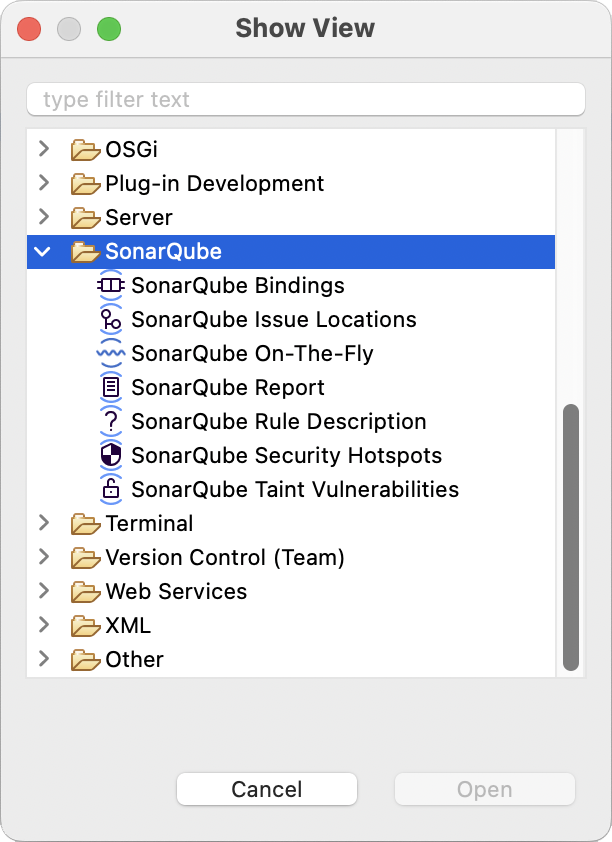
- In one of the SonarQube view windows listed below:
- SonarQube Bindings: A list of the SonarQube (Server, Cloud) and SonarQube Community Build connections and projects bound to SonarQube for Eclipse. Right-click on items for to reveal management options.
- SonarQube Issue Locations: This view shows the context around your issue and the different locations that are important to understand the issue.
- SonarQube On-The-Fly: Here you will find issues found in files you select in the Package/Project Explorer. If no file is selected, this view will report issues found in the active file. The On-The-Fly list is updated when you open a new file, or save your active file.
- SonarQube Report: The Report view includes issues found when running an analysis from the Eclipse Project or Package Explorer, including issues found when you analyze more than one file.
- SonarQube Rule Description: This view provides the rule description for the selected issue, giving context to the issue and often compliant and noncompliant examples of the rule violation.
- SonarQube Security Hotspots: This view displays security hotspots found on the SonarQube Server or SonarQube Community Build while running in Connected Mode. This view will open by default when you use the Open in IDE button in SonarQube Server, from a security hotspot.
*Note that Security Hotspots found by SonarQube Cloud are not yet available in SonarQube for Eclipse. - SonarQube Taint Vulnerabilities: Here you will find injection vulnerabilities reported by the SonarQube (Server, Cloud) when running in Connected Mode.
Double-clicking an issue found in one of the views will jump to the issue in the code editor; the issue will automatically be selected. For most issues, SonarQube for Eclipse offers information about why there is an issue and offers one or more actions to Fix your issue.
To open any views you are missing, navigate to Eclipse File Menu > Window > Show View > Other… > SonarQube > your SonarQube view.
Opening issues in the IDE
Understanding issues in context is a helpful way to address problems more effectively. Beginning in SonarQube Server 10.3, on SonarQube Cloud, and in SonarQube Community Build, it is possible to open all issues in your IDE, including taint vulnerabilities. Using the Open in IDE feature includes an automated connected mode setup to help with the process.
In your instance of SonarQube Server or SonarQube Community Build, or on SonarQube Cloud:
- Navigate to your Project > Issues page,
- select an issue’s detail view,
- and select the Open in IDE button as an authenticated user to edit the issue in your IDE.
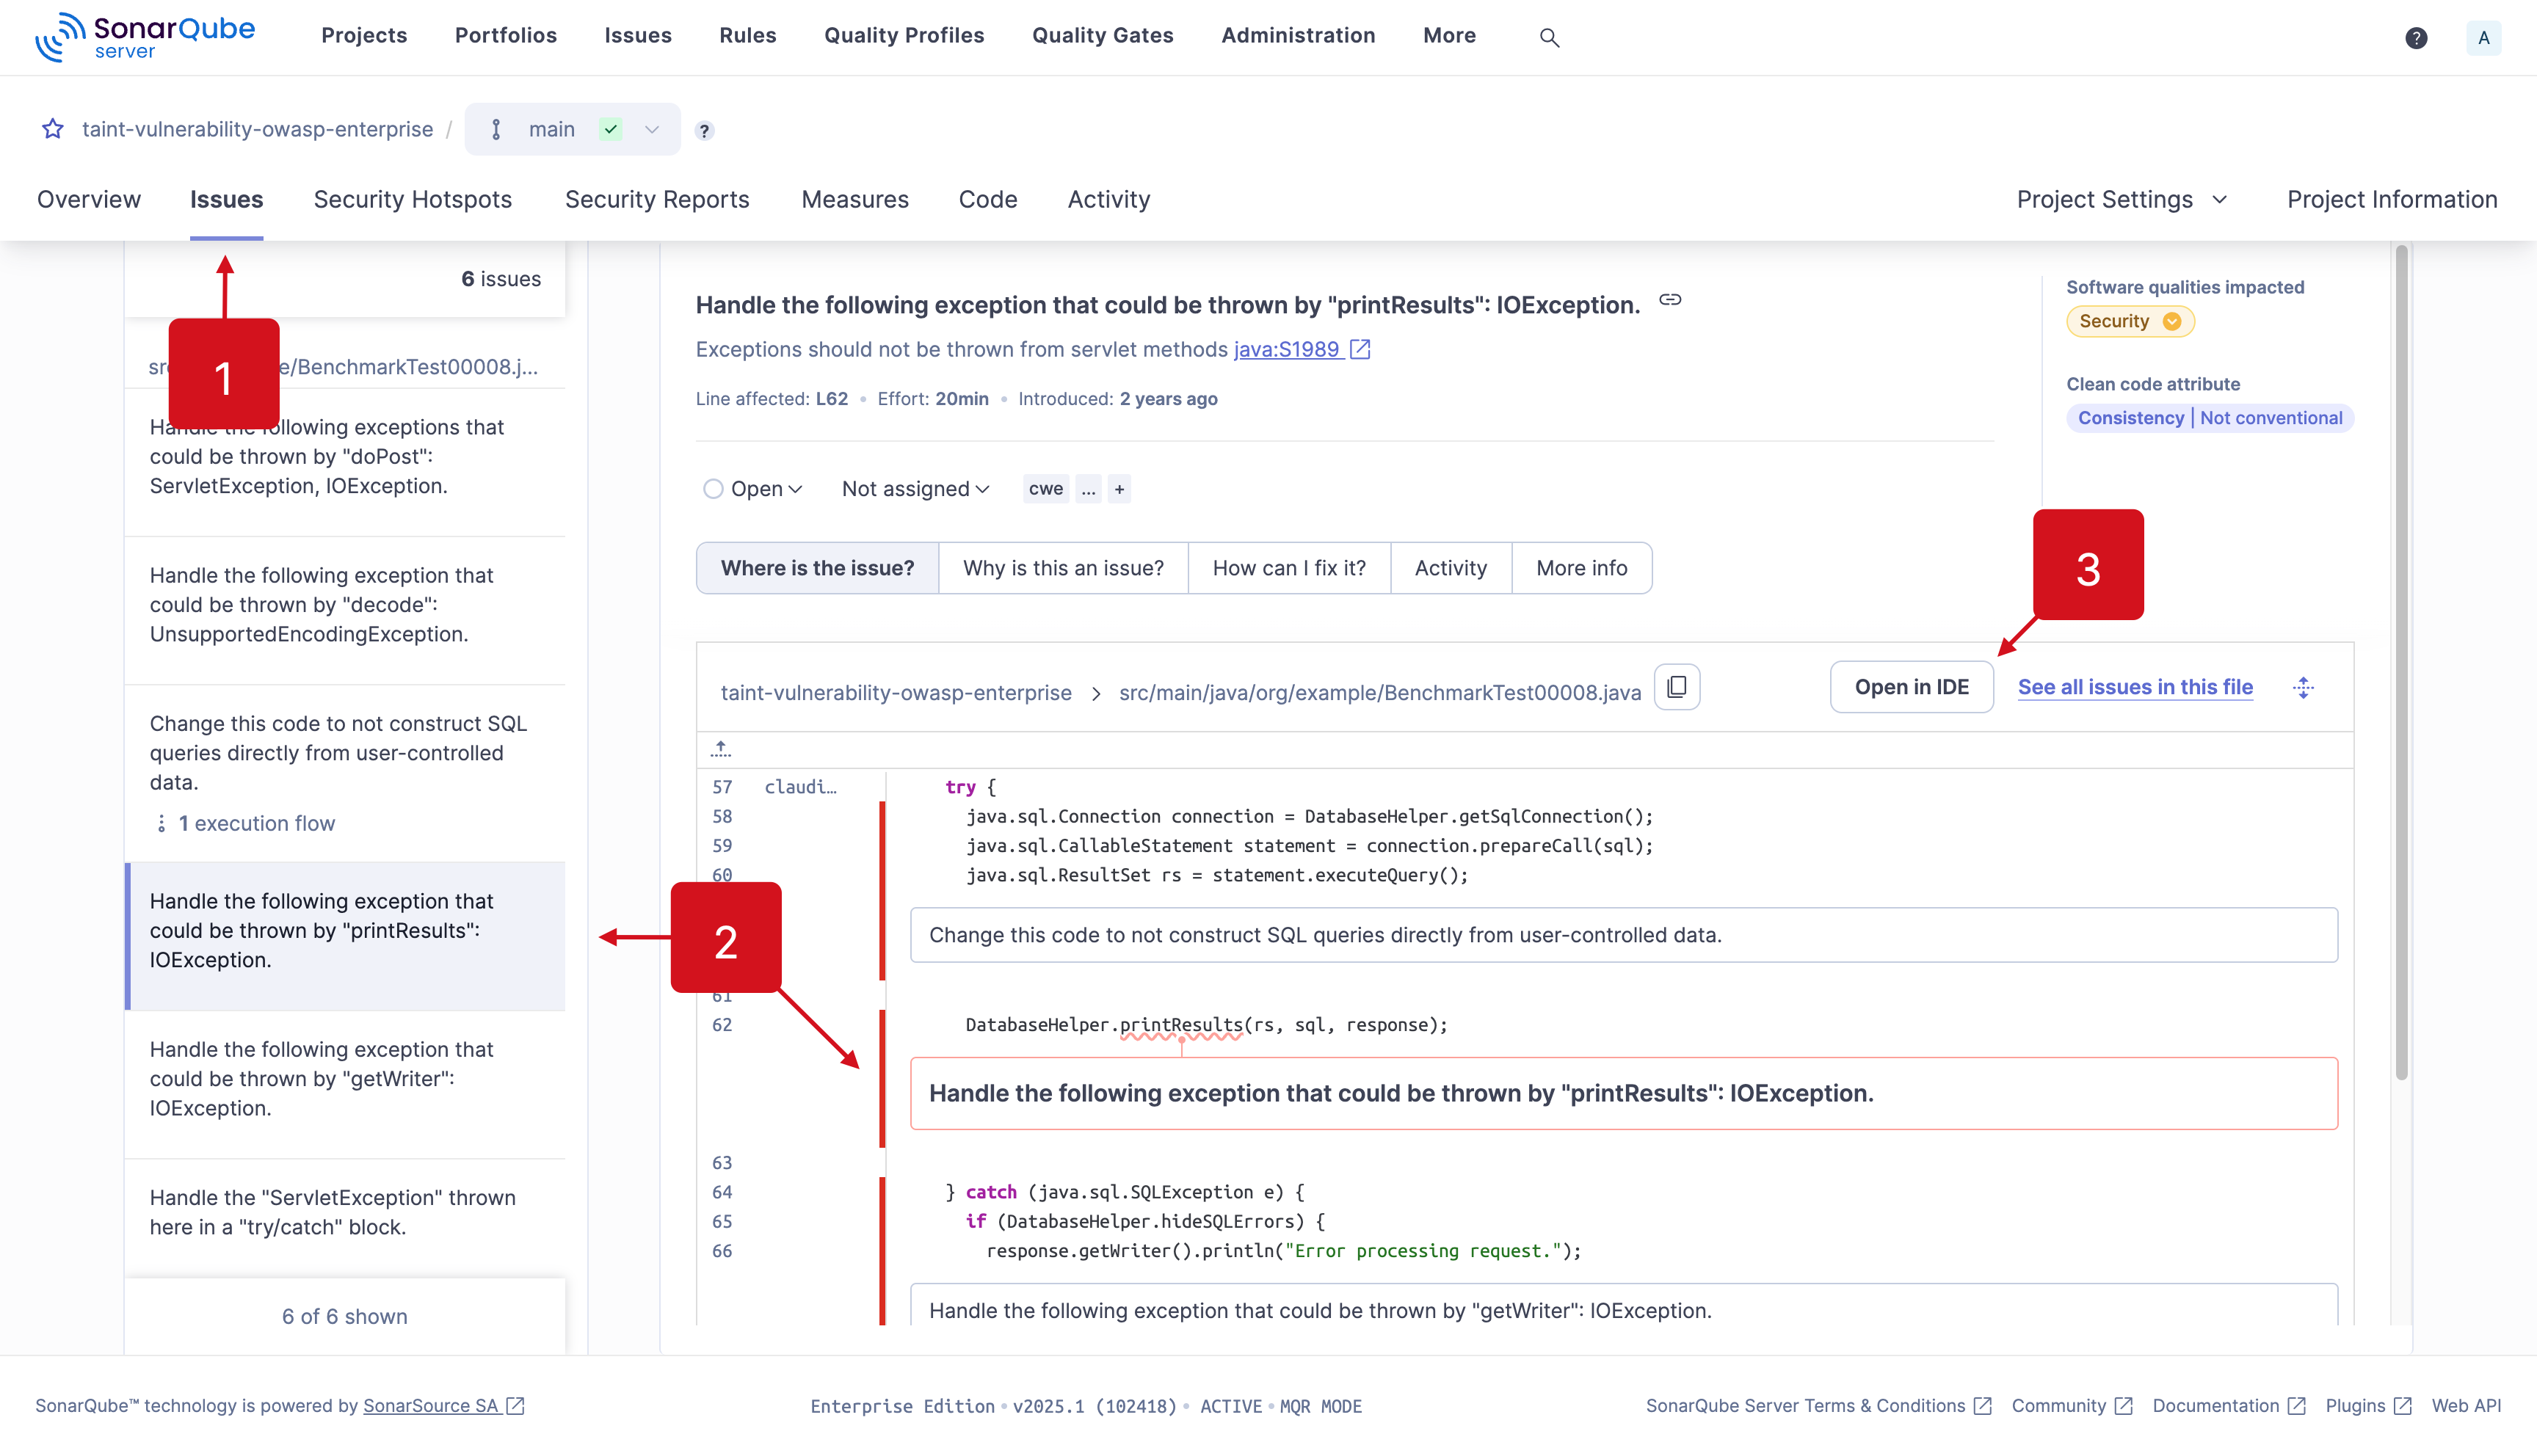
It’s best if your project is already open in the appropriate IDE and bound to the server using connected mode; if not, you will be prompted to set up a new connection and/or bind your project using the automatic connected mode setup feature.
If you’ve already fixed the issue in your code, SonarQube for IDE will not be able to find it; only the matching code will be highlighted. In this case, check that recent changes have been analyzed by SonarQube (Server, Cloud) or SonarQube Community Build, then check the documentation on the SonarQube Server, SonarQube Cloud, or SonarQube Community Build Issues page for details about managing your issues on the server.
Please see the Connected mode documentation to bind your project to an instance of SonarQube (Server, Cloud) or SonarQube Community Build. And if you have troubles with the automatic connected Mode setup, we identified the most common errors for Troubleshooting connected mode setup.
SonarQube (Server, Cloud) will offer AI-generated fix suggestions for issues detected in your code when AI CodeFix is enabled on your project. You can view the suggestions as a diff view directly in your IDE by selecting View Fix in IDE from the Issues page in SonarQube (Server, Cloud).
The process is similar to selecting the Open in IDE button: it’s best to set up connected mode beforehand. Otherwise, you’ll be prompted to set up a new connection and/or bind your project using the automatic connected mode setup feature.
SonarQube for Eclipse has the added feature that if you select Open in IDE from SonarQube (Server, Cloud) and SonarQube Community Build but haven't yet set up Connected mode, it will prompt you through the connection wizard, step-by-step, and help you bind the project.
Focusing on new code
The Focus on new code feature highlights only new code and works when SonarQube for Eclipse is running in either connected mode or standalone mode and must be enabled manually. Please see the New code page to understand your options when using a New Code Definition.
Setting your focus on new code has these prerequisites running in Connected Mode:
- Your local project must be bound to a project in SonarQube Server, SonarQube Cloud, or SonarQube Community Build.
- The new code definition must be defined in SonarQube (Server, Cloud) or SonarQube Community Build using a Previous version, Number of days, or Specific analysis.
- The Reference branch new code definition is not supported. Please check the documentation in SonarQube Server, SonarQube Cloud, or SonarQube Community Build to properly set your new code definition.
Setting the focus on new code is easy. To show or hide issues found in your Overall code, go to Eclipse Window > Preferences > SonarQube (or Eclipse > Settings… > SonarQube for Mac OS) and select Show SonarQube markers only for New code.
When switching between modes, settings are applied globally to all projects open in your Eclipse workspace.
When deciding to override a globally defined new code definition at the project level in SonarQube (Server, Cloud) or SonarQube Community Build, note that it is not possible to specify a unique New Code Definition at the branch level and still activate the Show SonarQube markers only for New code option.
The SonarQube views
The On The Fly view
The On-The-Fly view displays issues found in the active file; this list is updated when you open a file or save your active file. Double-click an issue to jump to its line in the Eclipse code editor. Hovering over issues in the code editor will reveal a tooltip that reveals one or more Quick fixes.
The Report view
The Report view includes issues found when running an analysis from the Eclipse Project or Package Explorer. Right-click on a selection of one or more files or folders in either the Package or Project Explorer, and choose SonarQube > Analyze to populate this view. Unlike the On-The-Fly view, the Report view does not update when you save a file, but the classic squiggles will appear under issues found in the code editor.
When running an analysis on multiple files or projects, the SonarQube Report view will open automatically and present the issues found in your selection. Note that you can also select Analyze All Project Files from the Report tab, without having to select all project files from the Project Explorer.
The Issue Locations view
For example, if a single issue has multiple locations or is part of an injection vulnerability flow, it will appear in the SonarQube Issue Locations view. For issues with multiple locations, a count of additional locations will be appended to the issue description found in any SonarQube for Eclipse view.
Injection vulnerabilities (also called taint vulnerabilities) are displayed a bit differently in the code editor and SonarQube for Eclipse views to better illustrate the flow of information from sources (user-controlled inputs) to sinks (sensitive functions). The SonarQube Taint Vulnerabilities view will list the vulnerabilities by occurrence, and the Issue Locations view will sequentially report the data flow. Selecting a flow item from the Issue Locations view will highlight the corresponding instance in the Eclipse code editor.
When running SonarQube for Eclipse in Connected mode, locations are displayed similarly in SonarQube for Eclipse as they are in SonarQube (Server, Cloud) and SonarQube Community Build. Selecting the issue in either the Eclipse code editor or the Issue locations view will highlight the reverse to help you understand the problem in context. Below you can see the similarities between SonarQube Server (left) and SonarQube for Eclipse (right).
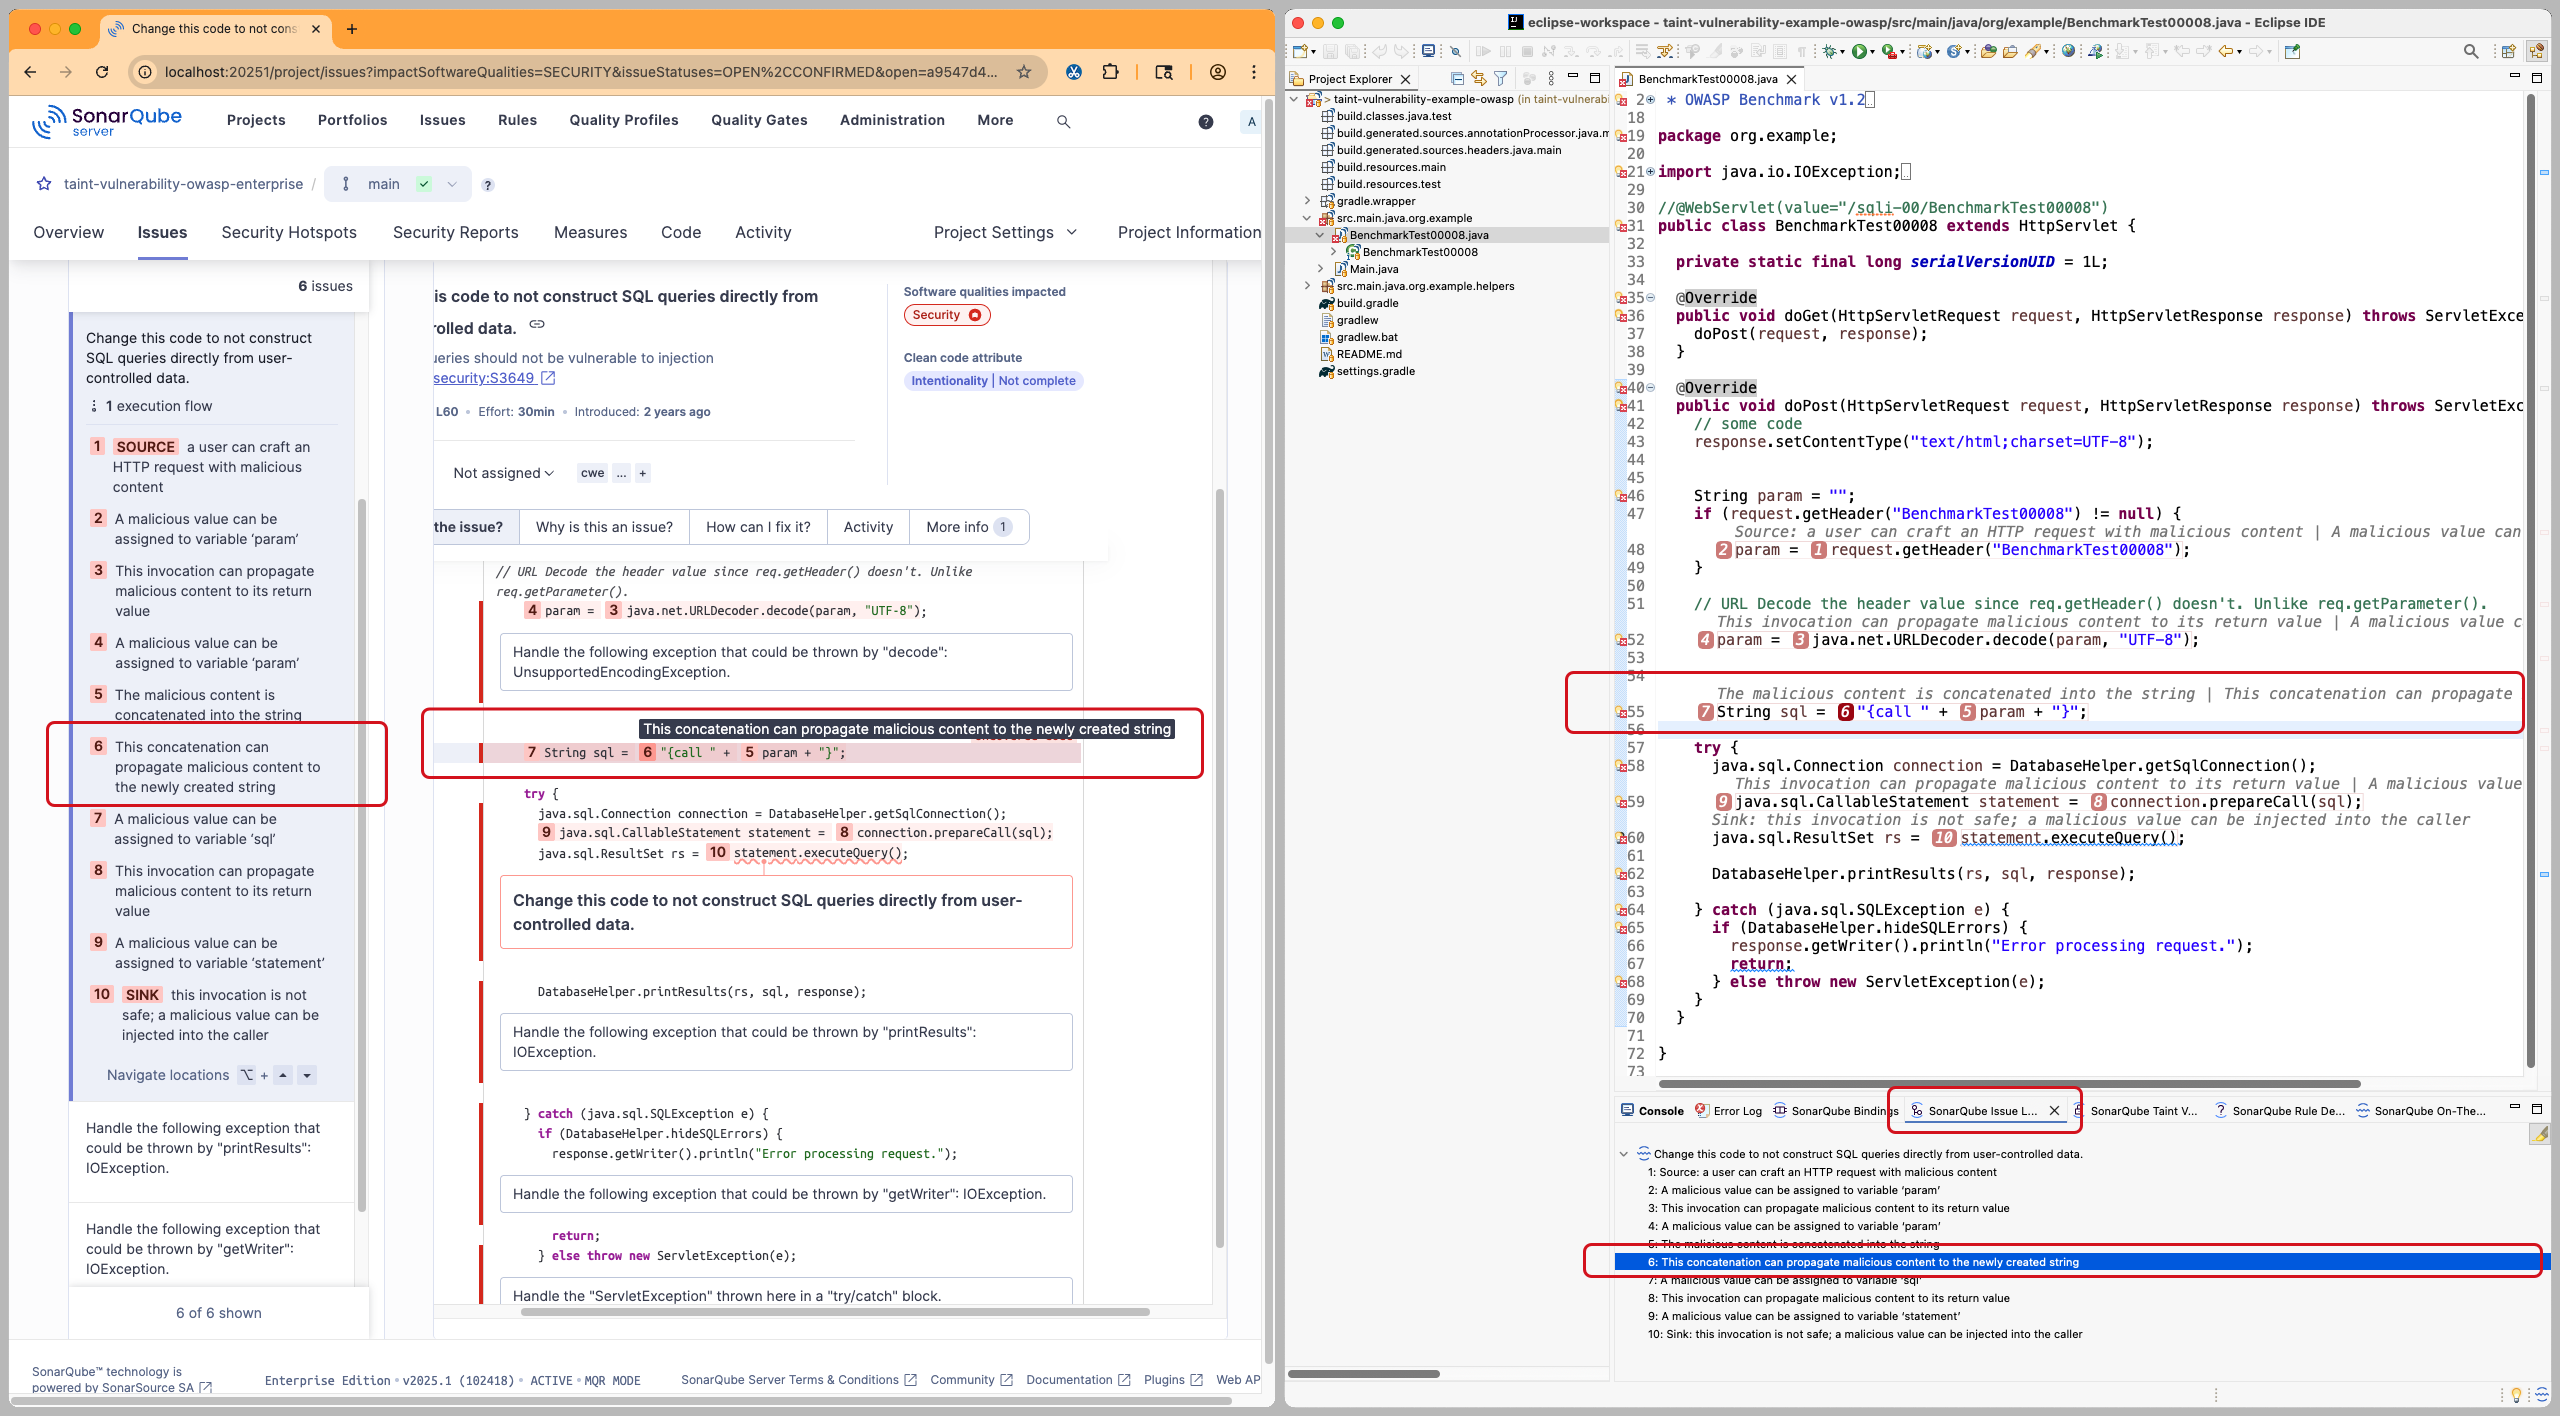
If you don’t see the data flow displayed in the code editor for injection vulnerabilities, check that code minings are enabled in the Preferences > Java > Editor > Code Minings menu.
Please have a look at the SonarQube for Eclipse documentation on Security hotspots and Injection vulnerabilities for more details about working with each issue type in SonarQube for Eclipse.
The Rule Description view
The SonarQube Rule Descriptions view is usually your first step in identifying why you have an issue. Right-clicking on any issue in a SonarQube for Eclipse view, or exposing the tooltip and selecting Open description of rule… in the code editor will open the SonarQube Rule Descriptions view.
The Rule Descriptions include information about why this causes an issue and noncompliant/compliant code snippets are usually offered. More serious issues such as security hotspots and injection vulnerabilities often include information about why it’s an issue and what is the potential impact.
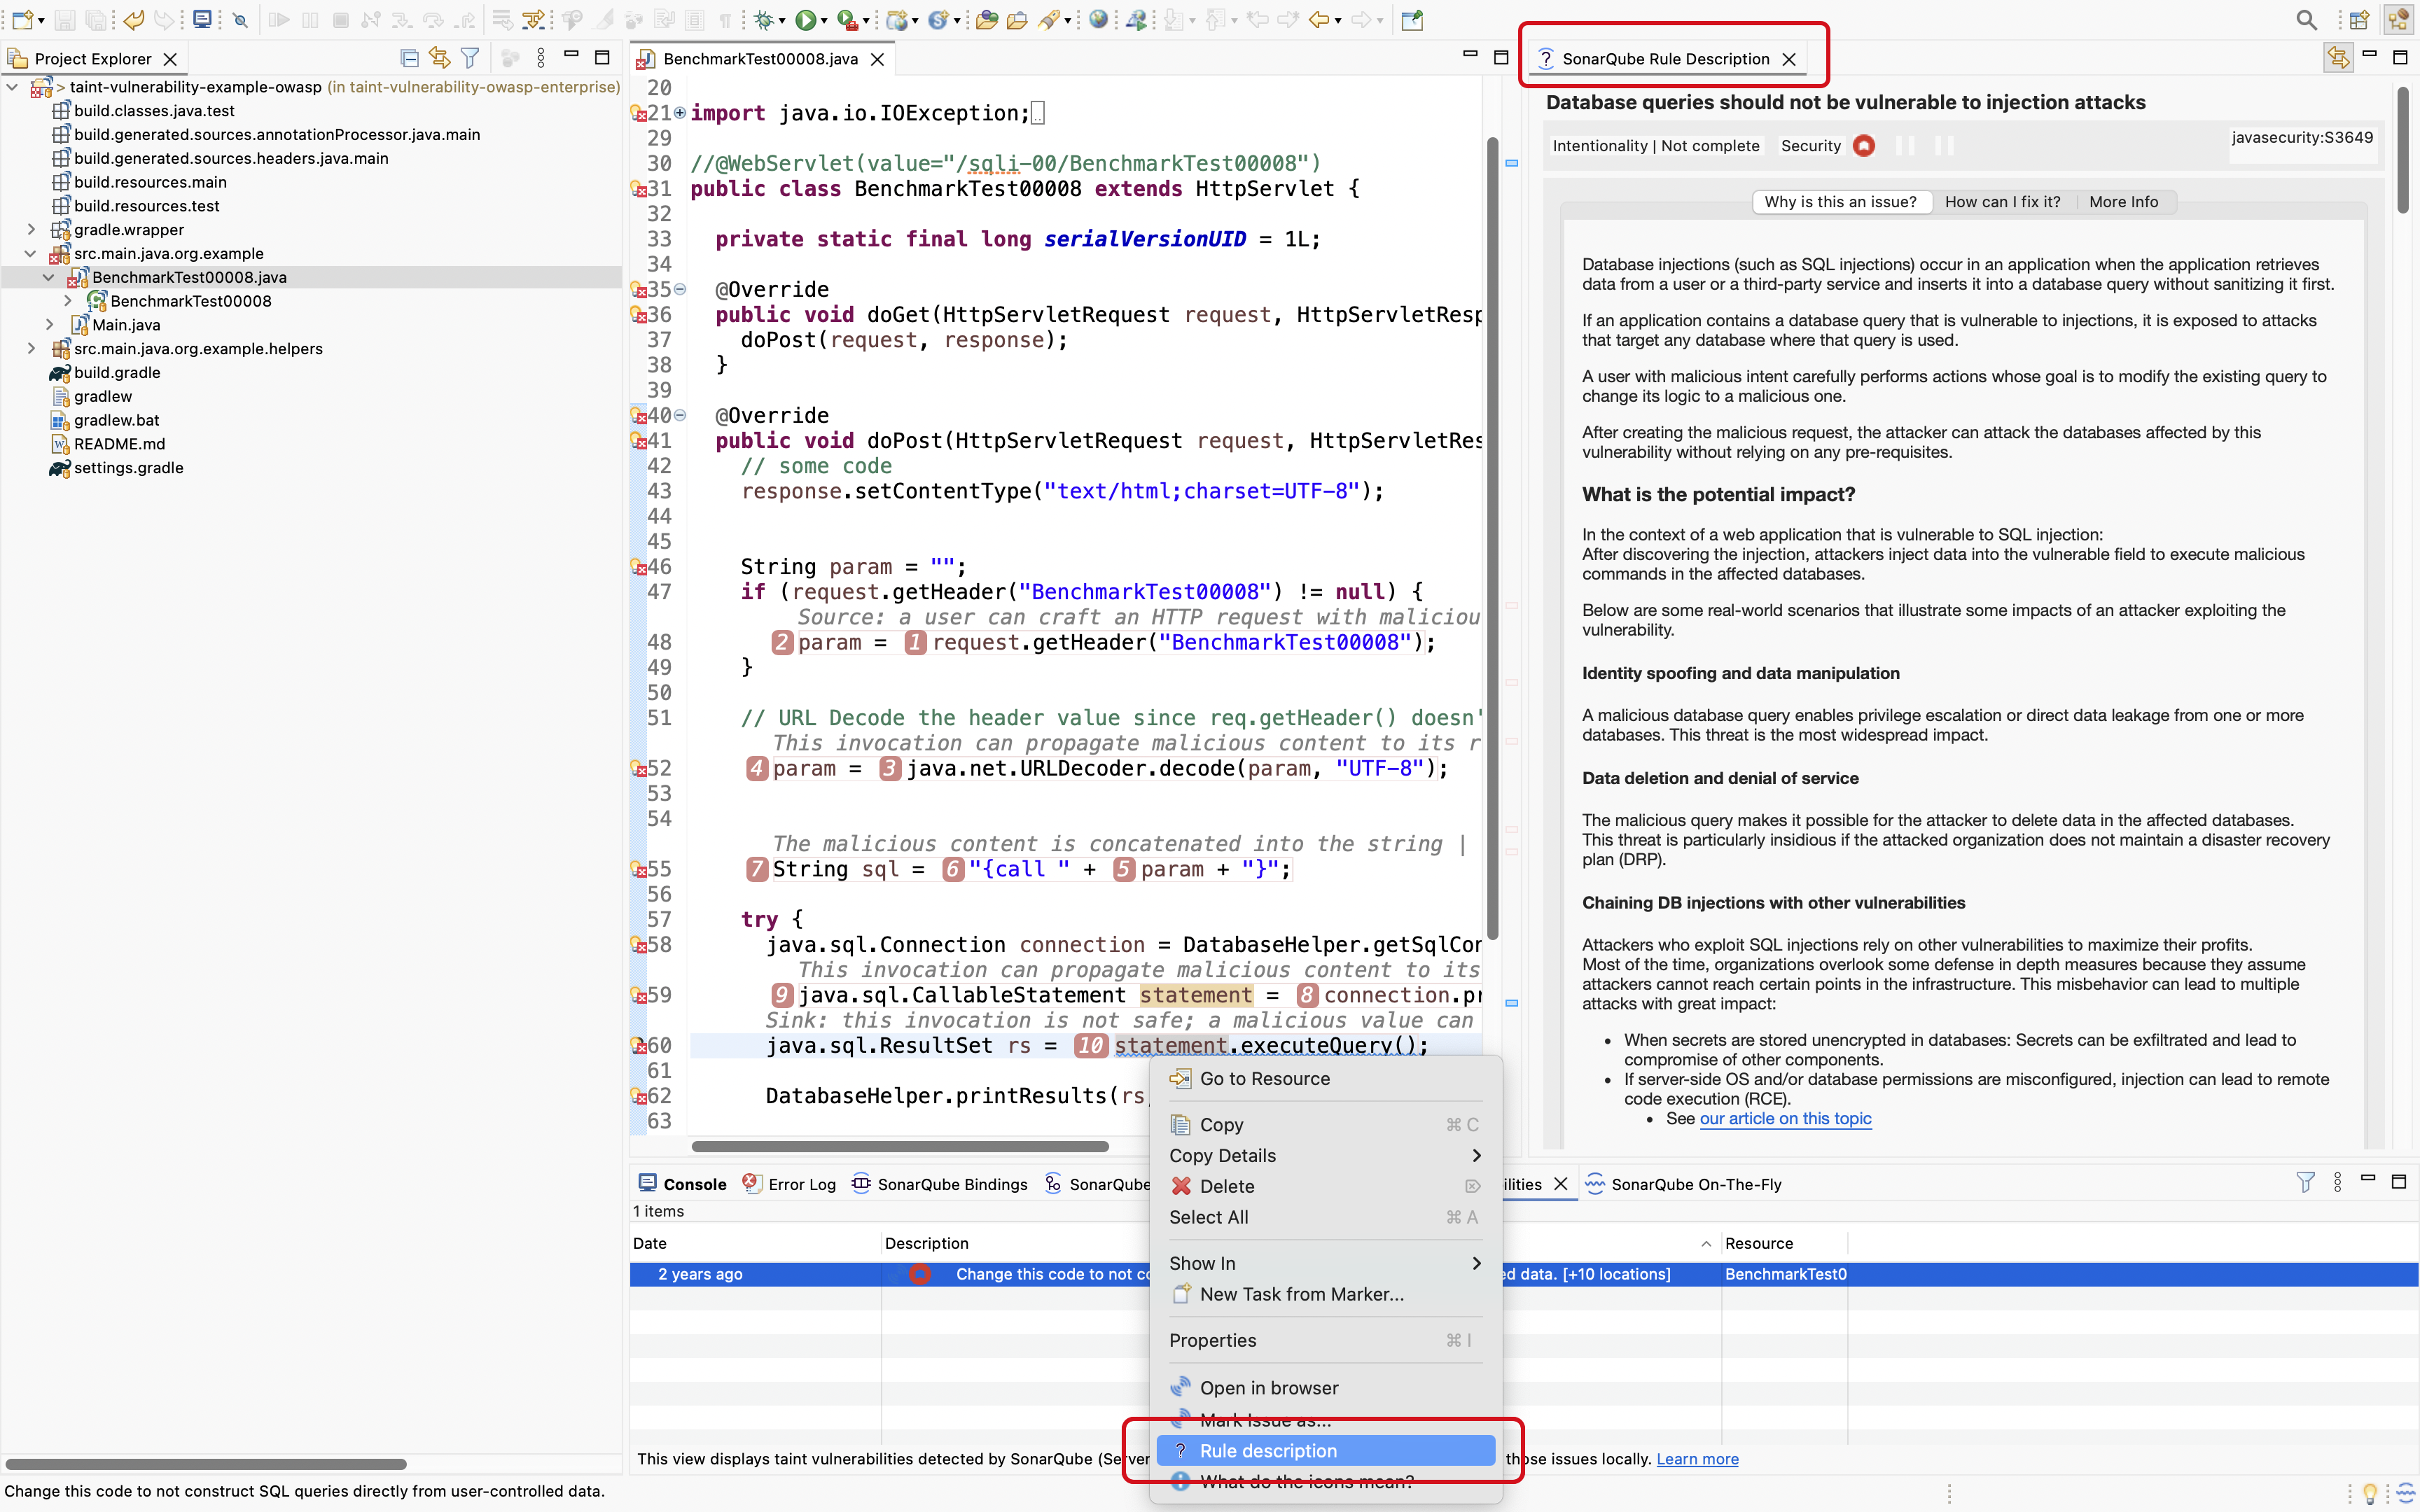
SonarQube for Eclipse supports syntax highlighting; its availability is dependent on the Eclipse version and plugins you have installed; note that JDT is required for Java syntax highlighting. Currently, syntax highlighting for Java and C / C++ languages are available.
Syntax highlighting is not available for languages accessed with external plugins, but an extension point is provided to plugin developers. More information on extension points will be coming soon...
Understanding issues in your IDE
An issue’s coding attribute, software qualities, and severity are presented to you when opening the SonarQube Rule Description view. Below the rule title, you will find the coding attributes that highlight an issue's classification. Check the glossary page for details about coding attributes, and the Software quality page to better understand software qualities for more details about how they help classify your issue.
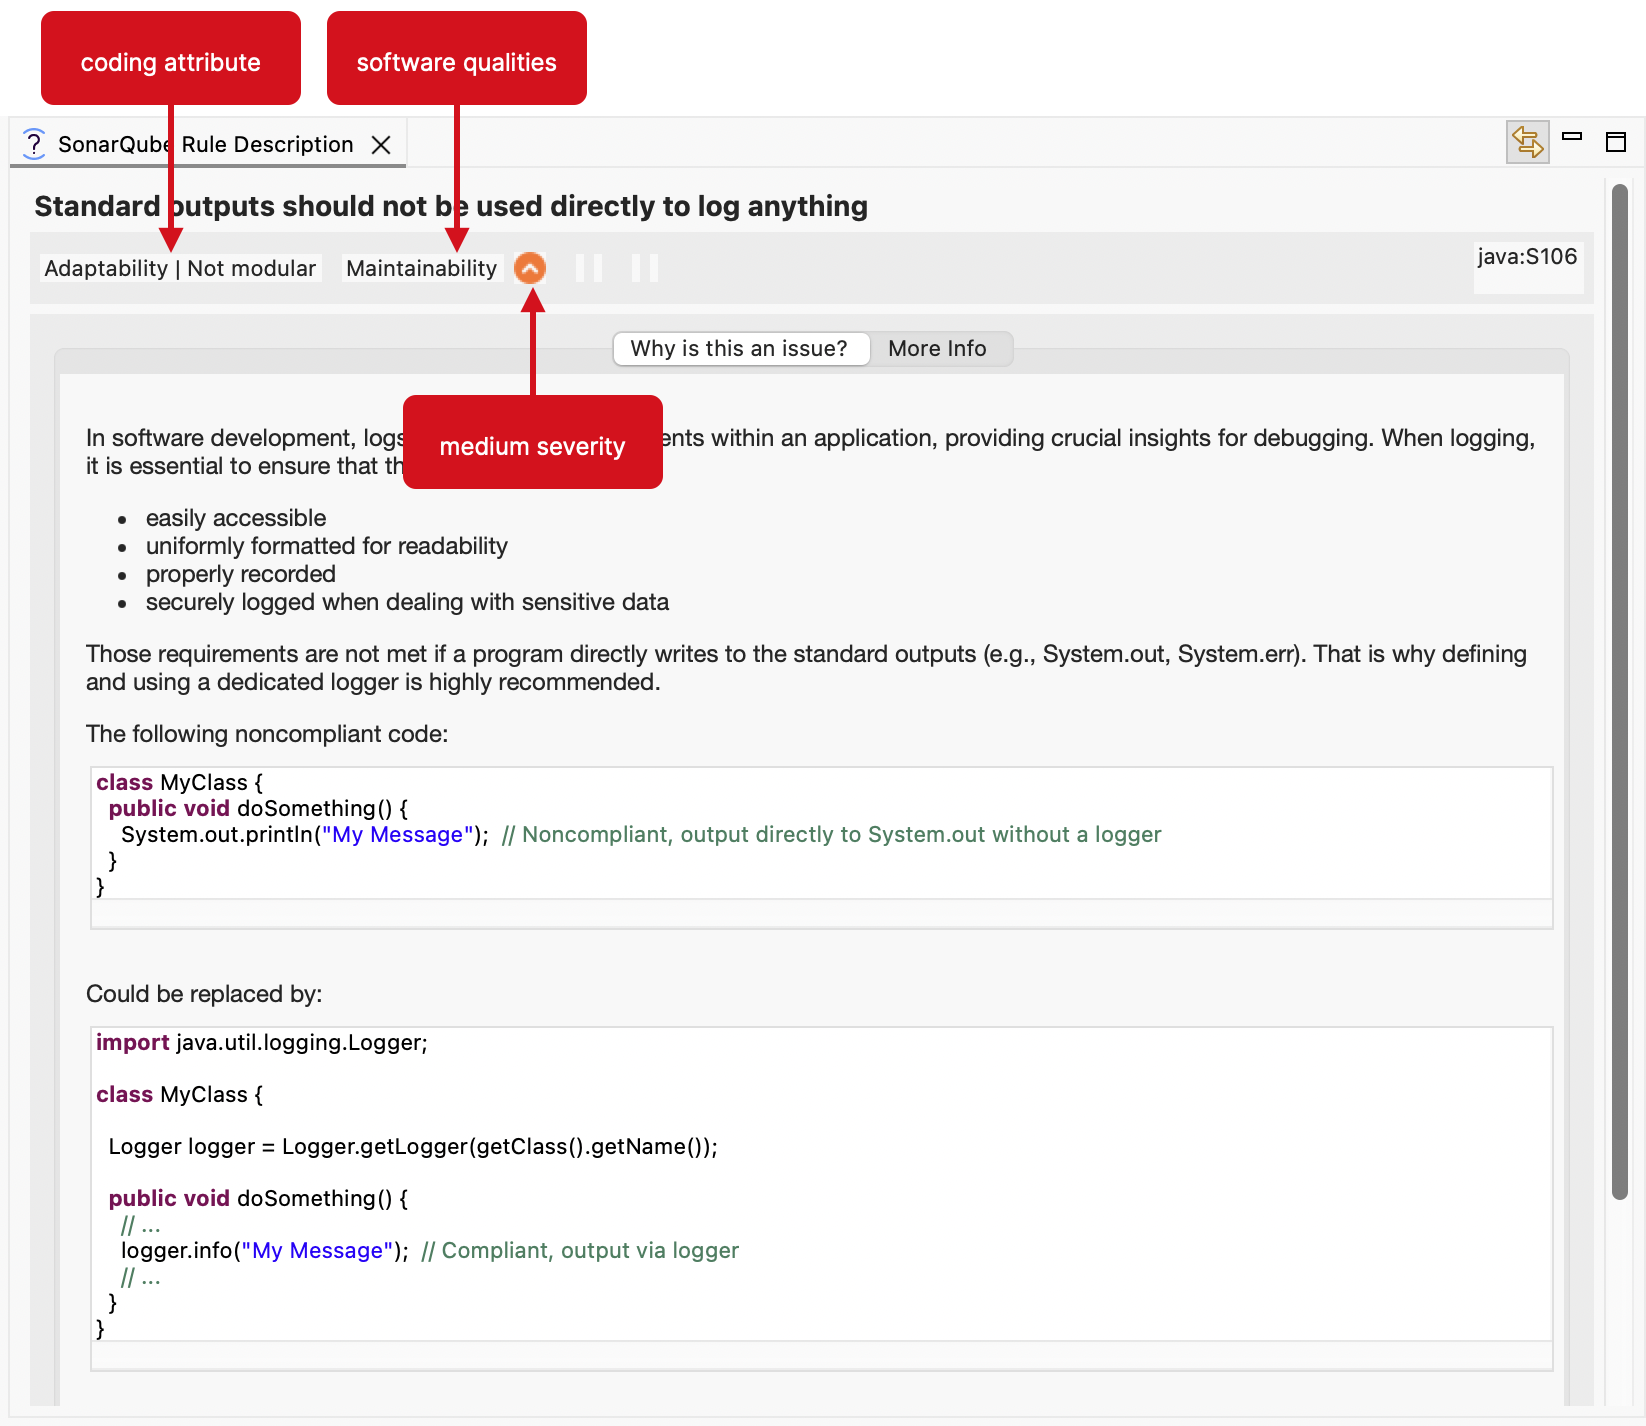
When in connected mode
If you’re running SonarQube for Eclipse while in connected mode with SonarQube Server or SonarQube Community Build, your view will change according to the server settings. Standard Experience mode encompasses the use of rule types such as bugs, code smells, and vulnerabilities. Alternatively, if SonarQube Server is set to Multi-Quality Rule mode, you will more accurately represent the impact an issue has on all software qualities.
Please see the SonarQube Server and SonarQube Community Build articles for detailed information about the available rule modes.
Issue types
Eclipse supports having multiple projects open in the same workspace and you may notice changes in the issue badges when switching between projects. The Standard Experience issue type descriptions will be displayed when running SonarQube for Eclipse version 8.0+ in connected mode with older versions of SonarQube Server. This is because previous versions of SonarQube Server including the 9.9 LTS do not include Multi-Quality Rule mode.
Knowing your server connection (when in connected mode) and your configuration is important because it impacts which issues you see in SonarQube for Eclipse when using the Group by feature (see the next article below).
These factors define which classification system is presented for each configuration:
- SonarQube for Eclipse 8.0+ running without connected mode or in connected mode with SonarQube Cloud will present an issue’s coding attribute.
- SonarQube for Eclipse 8.0+ running in connected mode with SonarQube Server 10.2 to 10.7 will present an issue’s coding attribute.
- SonarQube for Eclipse 8.0+ running in connected mode with SonarQube Server 10.8 and newer or with SonarQube Community Build will present the issue types according to the mode defined on the server.


Check out the Coding attributes in the glossary for more information about the issue type classification system.
Grouping issues
To group issues in the SonarQube On-The-Fly, Report, or Taint Vulnerability views, open the 3-dots menu in the upper-right corner of your view and select Group by.
In SonarQube for Eclipse 8.0+, the two group methods available are Impact and Severity, which refer to the issue badge types. Because Eclipse does not support groupings based on state (for example, if connected to SonarQube Cloud, then...), you must manually select the group that corresponds with your connected mode status.
It is important that you select Severity or None when connected to older versions of SonarQube Server because you may find that some issue descriptions disappear from the view panel. Either group method works when not running in connected mode.
Please see the following summary according to your configuration:
When not in connected mode:
- Choose any of the three Group by options.
When in connected mode with SonarQube Cloud:
- Choose Impact or None. Do not choose Severity.
When in connected mode with SonarQube Server 10.8 to latest or SonarQube Community Build:
- Choose Impact or None when in Multi-Quality Rule mode and Severity when using Standard Experience.
For older versions of SonarQube Server (before 10.7):
- When in connected mode with SonarQube Server 10.1 to 10.7:
- Choose Impact or None. Do not choose Severity.
- When in connected mode with SonarQube Server 10.1 and earlier:
- Choose Severity or None. Do not choose Impact.
- See the Issues page in the SonarQube Server 9.9 docs for information about issue descriptions.
If you choose the incorrect impact badge display style that does not match your version of SonarQube Server or SonarQube Community Build and the rule mode you select (where applicable), you may find that some issue descriptions disappear from the view panel.
Refer to the Issue types article above to determine which versions of SonarQube Server, SonarQube Cloud, or SonarQube Community Build display which issue types.
Was this page helpful?