Investigating issues
SonarQube for IDE can help developers by letting them perform local analyses to check their code before pushing it back to the SCM. While running an analysis, SonarQube for IDE raises an issue every time a piece of code breaks a coding rule.
Usually, a first analysis is performed as soon as one of the supported files is opened. Then, regular analyses are triggered when the editor content changes and/or when the file is saved.
This page describes how to find and investigate issues in your IDE.
Defining issues
An issue is a problem in your code that violates one of the Sonar rules. Issues found in code are linked to coding attributes and software qualities that determine the overall severity of an issue. Software qualities determine the overall severity of an issue that feeds back into the overall status of your code; please see the SonarQube Server or SonarQube Cloud documentation for more information about quality standards and new code.
Each issue is linked to one coding attribute which is associated with one or more software qualities; each software quality has a level of severity. See Software qualities for more information.
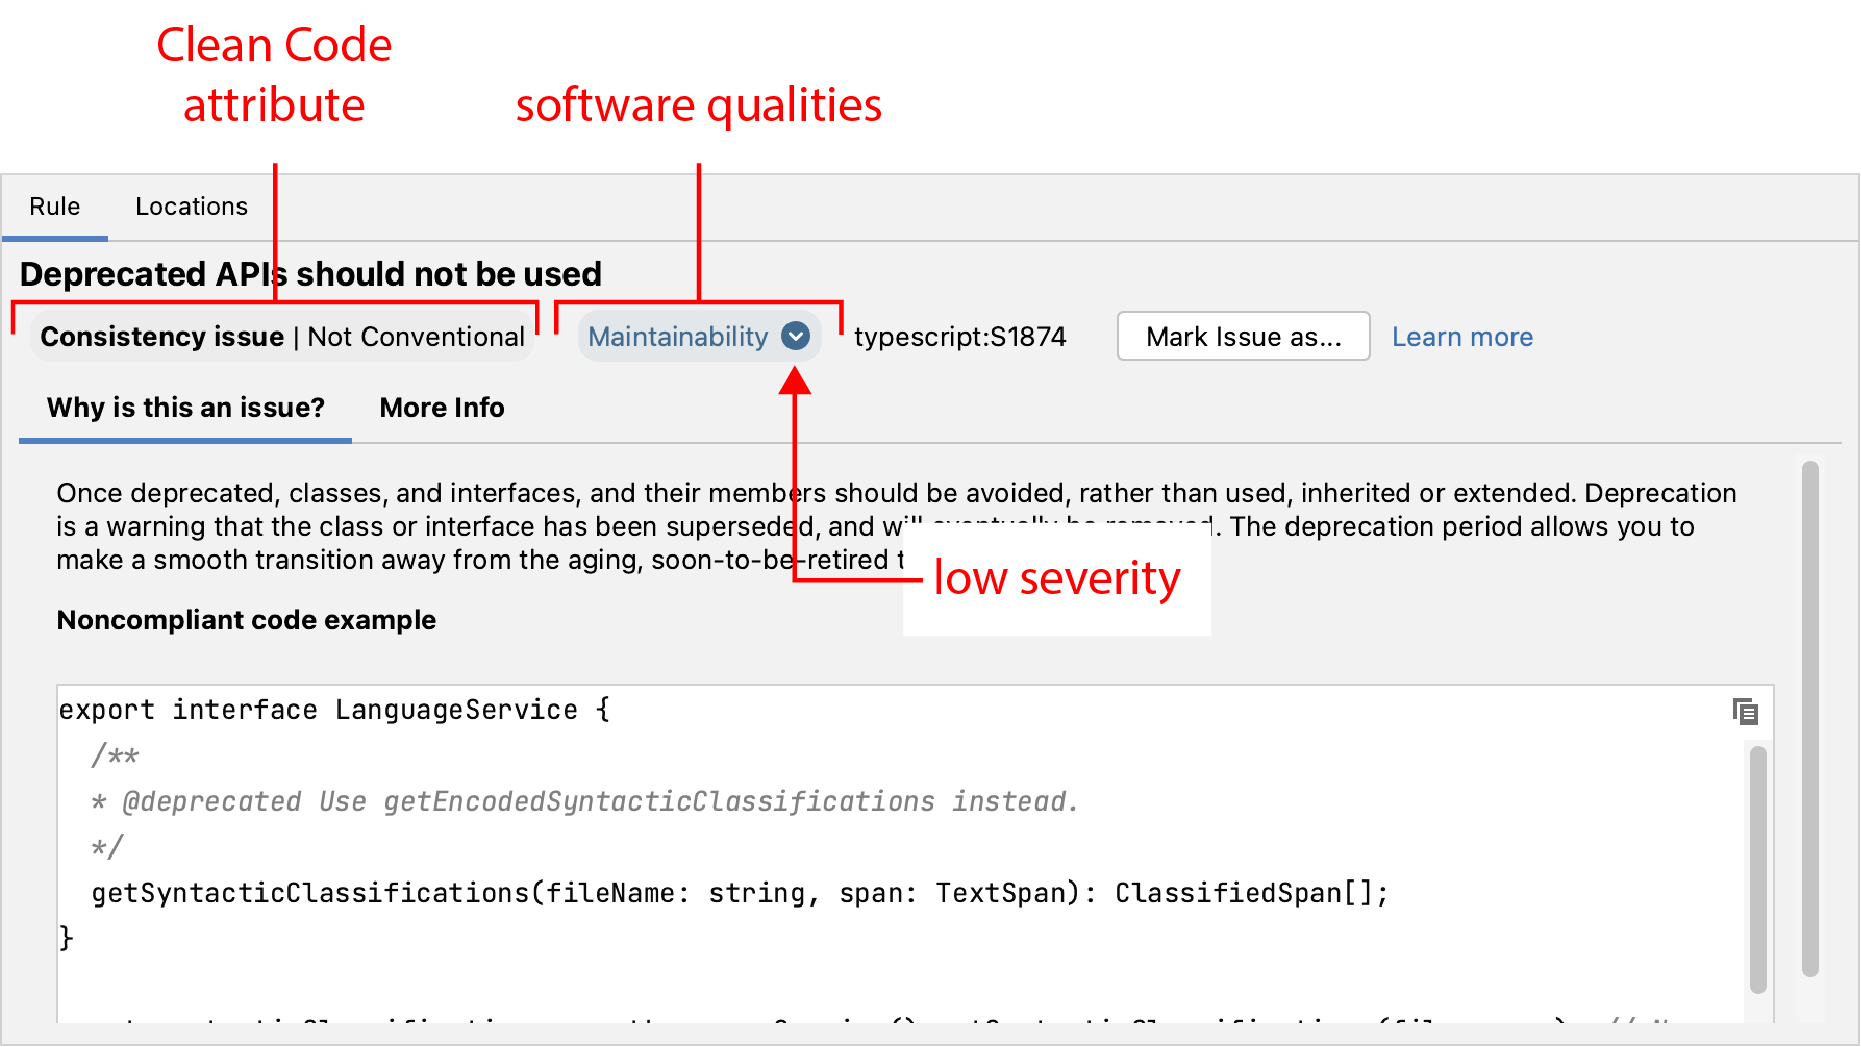
To communicate the code attributes, software qualities, and severity of issues found in your code, SonarQube for IDE displays them in the Rule tab as described below.
Finding issues
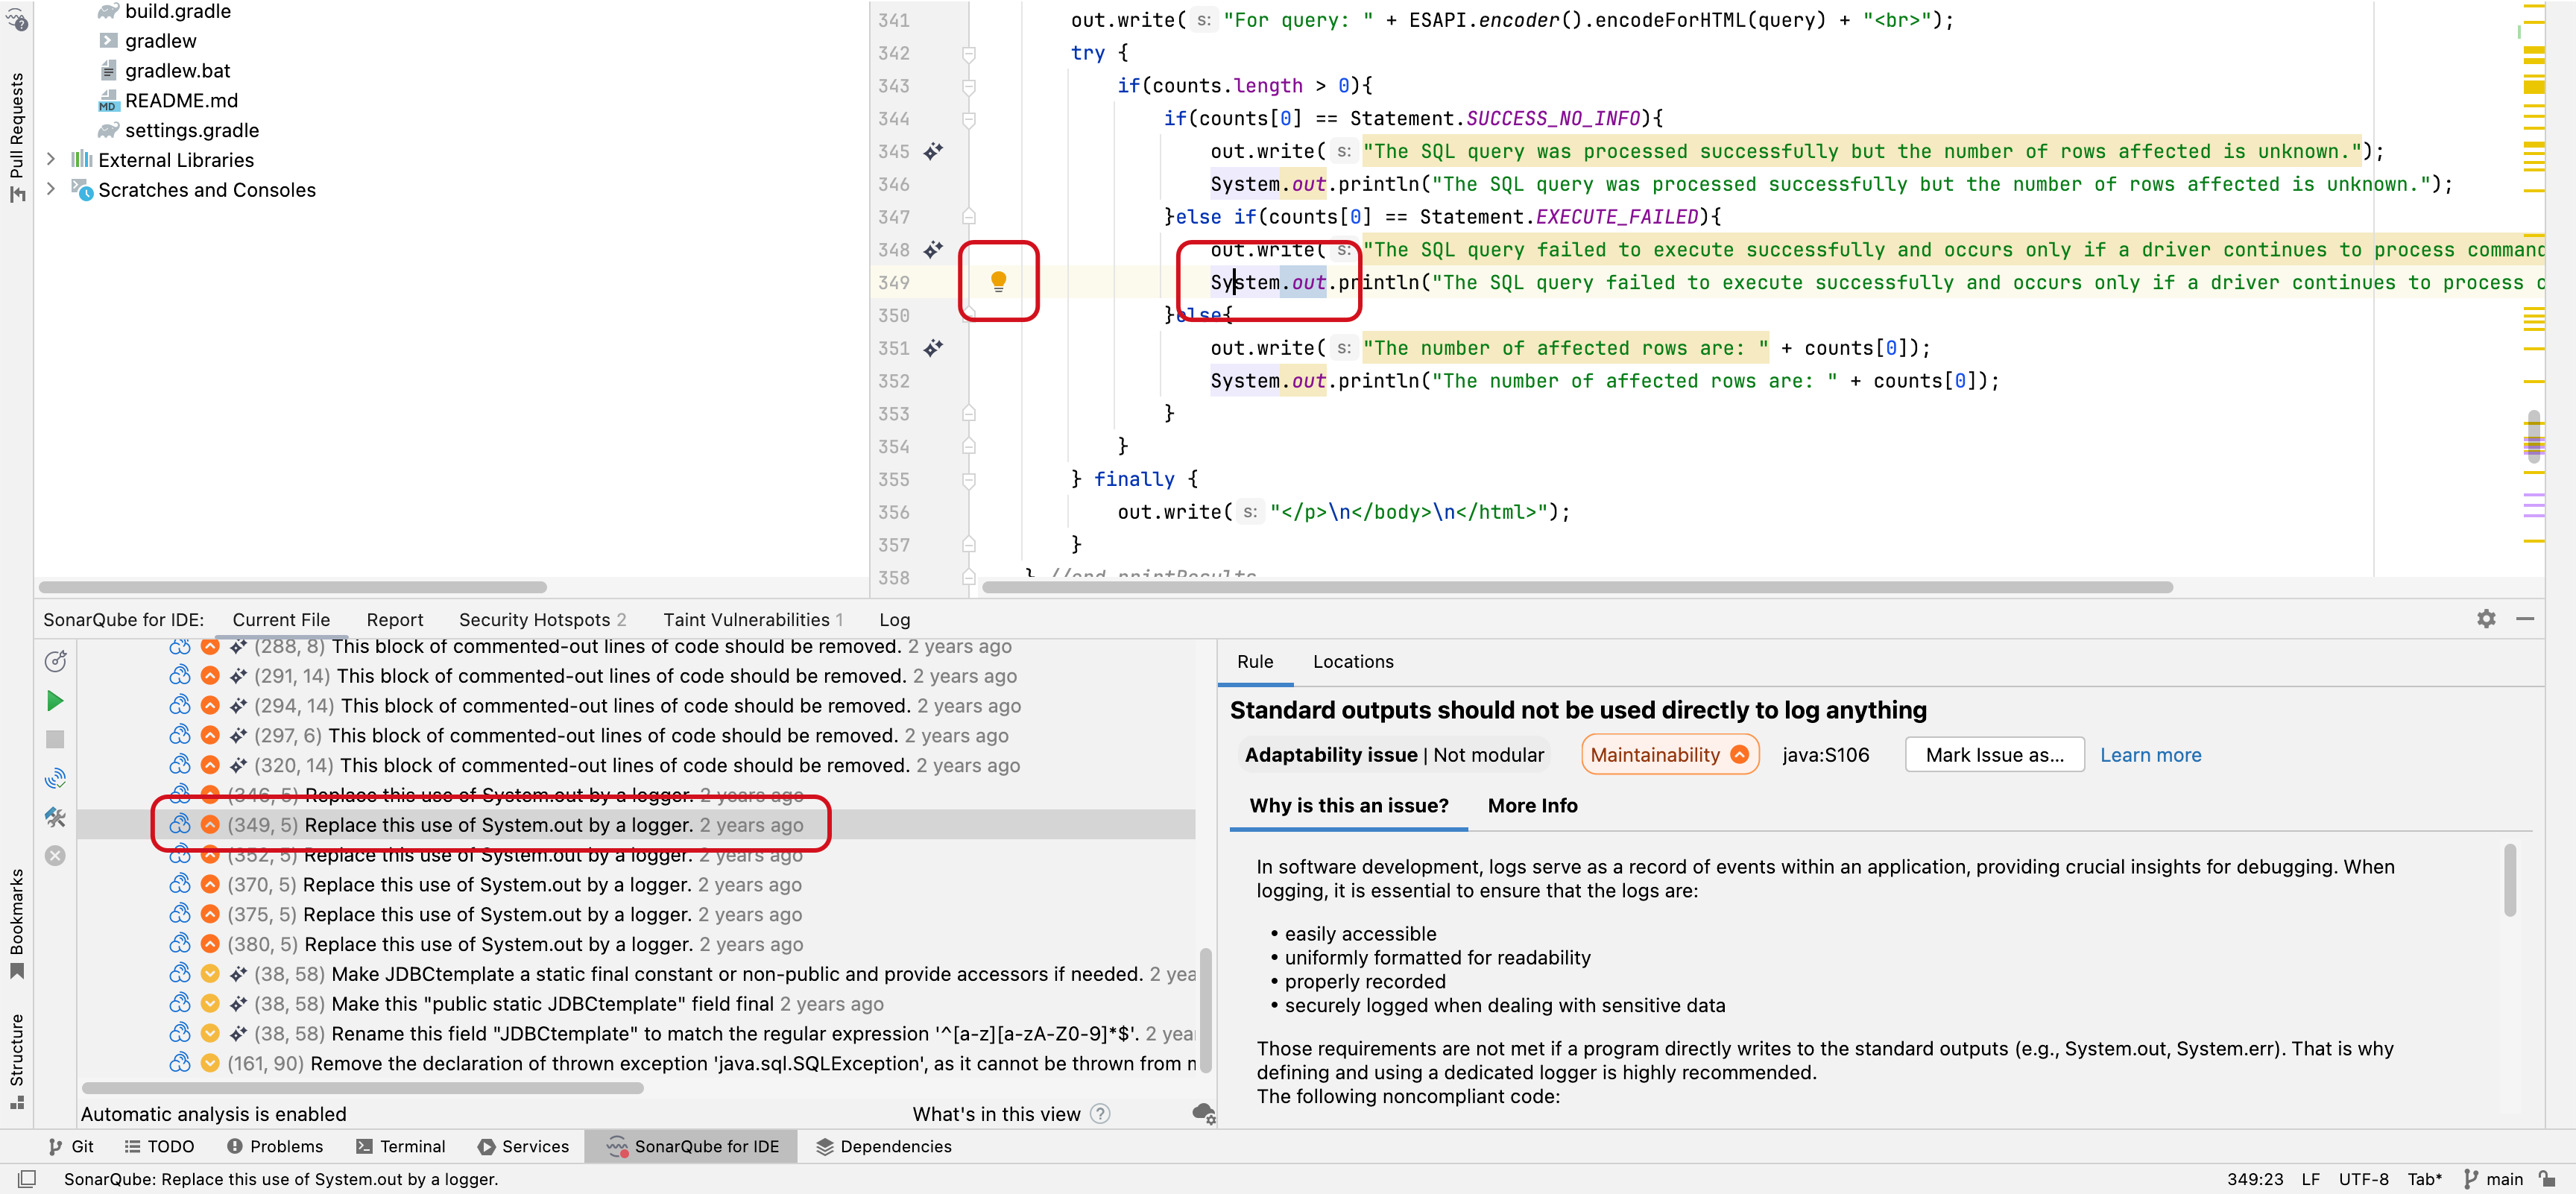
For most issues, SonarQube for IDE provides information about why there is an issue and offers one or more actions to Fix your issue. Information is displayed in 4 places:
- In the IntelliJ Text Editor, identifiable by the classic squiggles underlining issues in the code.
- In the SonarQube for IDE view window under the Current file tab for issues found in the active file.
- In the Tooltip, you will find a recommended action(s) found by clicking on the light bulb in the left margin of the code explorer.
- In the SonarQube for IDE view window, Report tab. In the Report tab, open the collapsable file menu to view the file’s issues.
Opening issues in the IDE
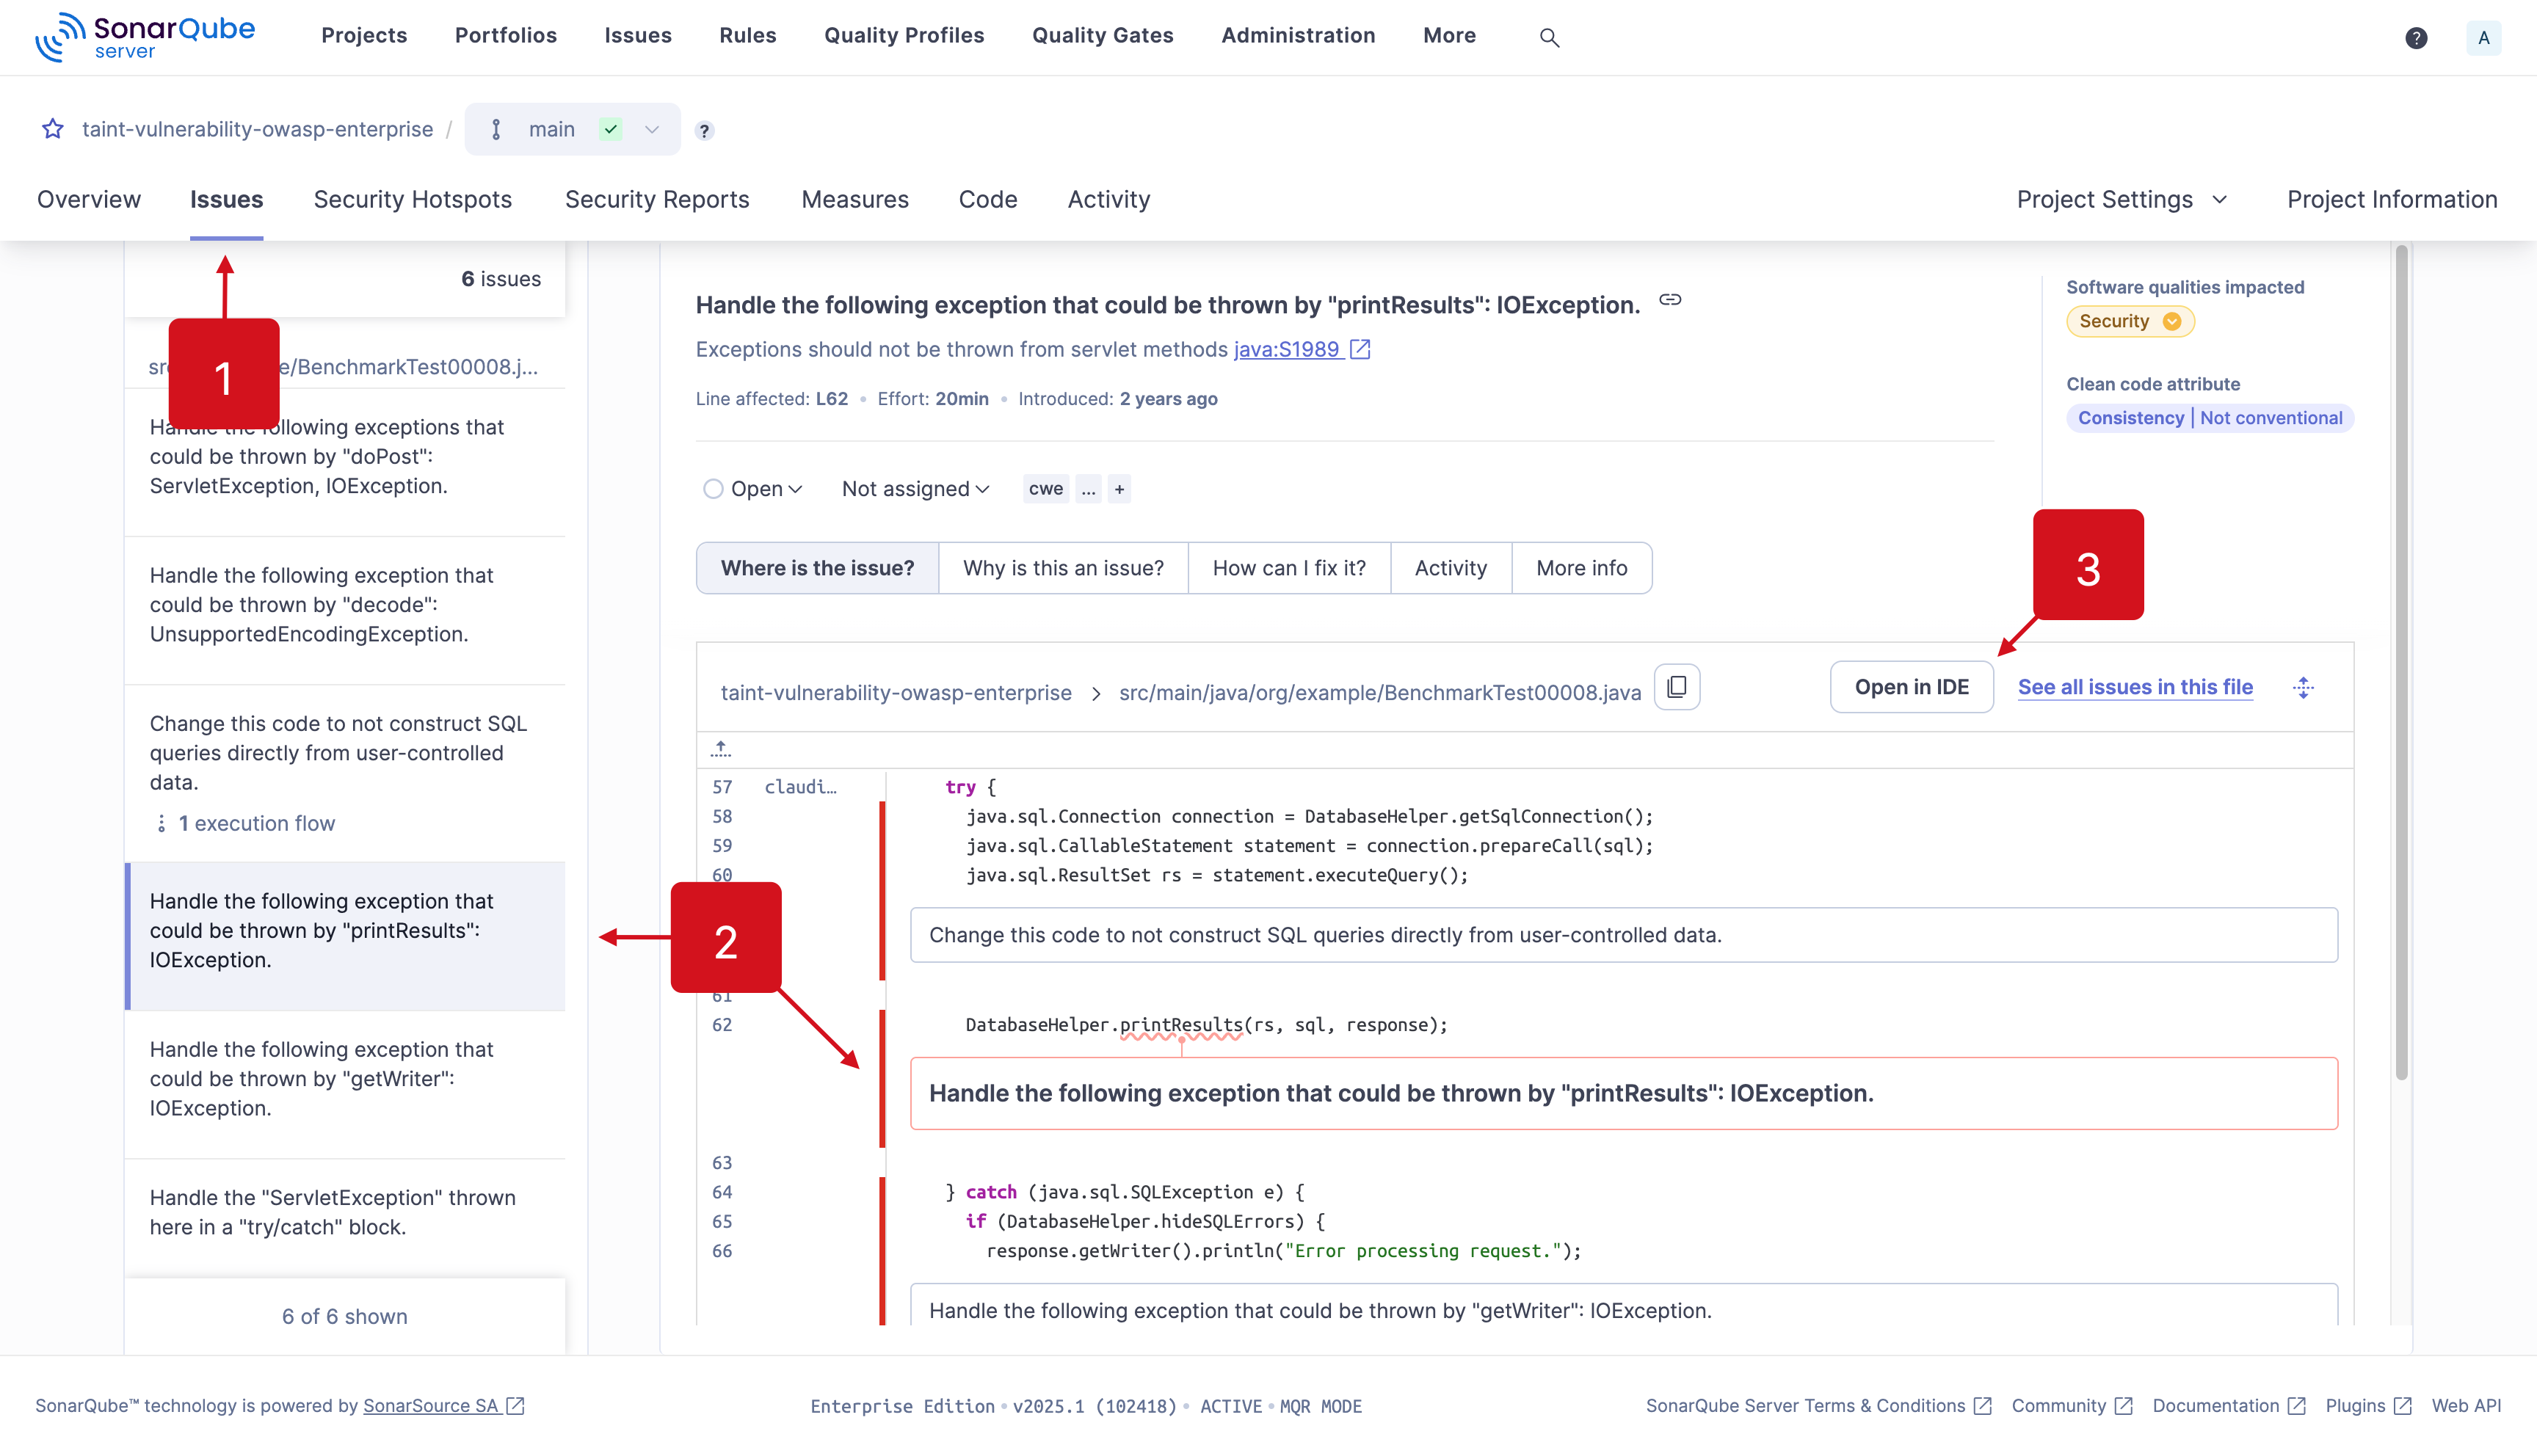
Understanding issues in context is a helpful way to address problems more effectively. Beginning in SonarQube Server 10.3, on SonarQube Cloud, and in SonarQube Community Build, it is possible to open all issues in your IDE, including taint vulnerabilities. Using the Open in IDE feature includes an automated connected mode setup to help with the process.
In your instance of SonarQube Server or SonarQube Community Build, or on SonarQube Cloud:
- Navigate to your Project > Issues page,
- select an issue’s detail view,
- and select the Open in IDE button as an authenticated user to edit the issue in your IDE.

It’s best if your project is already open in the appropriate IDE and bound to the server using connected mode; if not, you will be prompted to set up a new connection and/or bind your project using the automatic connected mode setup feature.
If you’ve already fixed the issue in your code, SonarQube for IDE will not be able to find it; only the matching code will be highlighted. In this case, check that recent changes have been analyzed by SonarQube (Server, Cloud) or SonarQube Community Build, then check the documentation on the SonarQube Server, SonarQube Cloud, or SonarQube Community Build Issues page for details about managing your issues on the server.
Please see the Connected mode documentation to bind your project to an instance of SonarQube (Server, Cloud). And if you have troubles with the automatic connected mode setup, we identified the most common errors for Troubleshooting connected mode setup.
SonarQube (Server, Cloud) will offer AI-generated fix suggestions for issues detected in your code when AI CodeFix is enabled on your project. You can view the suggestions as a diff view directly in your IDE by selecting View Fix in IDE from the Issues page in SonarQube (Server, Cloud).
The process is similar to selecting the Open in IDE button: it’s best to set up connected mode beforehand. Otherwise, you’ll be prompted to set up a new connection and/or bind your project using the automatic connected mode setup feature.
Focusing on new code
The Focus on New Code feature highlights only new code and works when SonarQube for IDE is running in either connected mode or standalone mode and must be enabled manually. Please see the New code page to understand your options when using a New Code Definition.
Setting your focus on new code has these prerequisites running in Connected mode.
- Your local project must be bound to a SonarQube (Server, Cloud) project.
- The new code definition must be defined in SonarQube (Server, Cloud) or SonarQube Community Build using a Previous version, Number of days, or Specific analysis.
- The Reference branch new code definition is not supported. Please check the documentation in SonarQube Server, SonarQube Cloud, or SonarQube Community Build to properly set your new code definition.
Focusing on new code is easy. After setting up connected mode and binding your folder to a project, use one of these 3 methods to activate the Set focus on new code feature:
- Select the target icon found in the left sidebar of the SonarQube for IDE > Current File tab.
- Select the SonarQube for IDE icon found in the upper-right corner of the IntelliJ > Editor.
- Navigate to IntelliJ > Settings > Tools > SonarQube for IDE and select Set focus on new code.
With the SonarQube for IDE focus mode deactivated, all issues found in your project will be shown in the same list.
When deciding to override a globally defined new code definition at the project level in SonarQube (Server, Cloud) or SonarQube Community Build, note that it is not possible to specify a unique new code definition at the branch level and still activate the SonarQube for IDE focus mode option.
The SonarQube for IDE tabs
The Current File tab
From the SonarQube for IDE view window, click the green arrow to analyze the active file; you will get a notice if Automatic analysis is enabled. Once the analysis is complete, select an issue from the list and review the Rule description in the right panel; a noncompliant and compliant code example will be presented for most rule violations. Some rule descriptions provide external links for more information.
The Locations tab gives you a list of locations where this issue is repeated within the current file; a list of corresponding numbers will appear next to your code in the Explorer to correlate the location report with the location in the current file. Double-clicking on the issue in this tab highlights the applicable code line in the explorer.
Hover over the highlighted code in the explorer to reveal one or more recommended actions.
Reports about secondary locations, even those issues occurring in multiple files, only include locations found in the current file. Similarly, locations found under the Report > Locations tab are locations found within the selected file, not locations found between all files.
The Report tab
Issues listed in the Report tab are displayed in a collapsible tree menu and present information regarding the Rule and the issue’s Locations in the same way as in the Current File tab. Information found in the Report > Locations tab about secondary locations are locations found within the selected file, not between all files.
The Security Hotspots tab
In SonarQube for IntelliJ, local detection of Security Hotspots is enabled if you are using Connected mode with a project on SonarQube Server, SonarQube Cloud, or SonarQube Community Build. Like the Report tab, Security Hotspots are displayed in a collapsible tree menu and present information regarding the Rule and the hotspot’s Locations. Hotspots found on the server are labeled with a SonarQube Server or Cloud icon; in this way, SonarQube for IntelliJ shows you hotspots that you may not want to introduce into your next server analysis.
Please see the Security hotspots page for more information about understanding hotspots in your IDE.
The Taint Vulnerabilities tab
SonarQube for IntelliJ relies on a SonarQube (Server, Cloud) analysis to report Taint Vulnerabilities in the IDE therefore, running in connected mode is required. Taint vulnerabilities found by the server are reported in the Taint Vulnerabilities tab; taint issues from all files are displayed in a collapsible tree menu.
Selecting a taint issue automatically opens the issue’s rule description. Opening an issue reveals the vulnerability’s flow or flows in the tree menu and also in the editor.
Please see the Injection vulnerabilities page for more information about understanding these types of issues in your IDE.
The Rule tab
The Rule tab is a sub-tab for each of the issue view tabs listed above, displaying information about your issue’s rule description.
Simply select an issue in the SonarQube for IDE view or choose SonarQube for IDE: Show rule description from the tooltip to open the Rule tab. Here, you will find a brief explanation of the rule as well as Noncompliant and Compliant code samples.

SonarQube for IntelliJ supports syntax highlighting. In addition, users are able to visualize a diff view for the non & compliant code samples which should help you fix your issue. Note that diff highlighting is only available for rules descriptions migrated to the new format, and we're progressively migrating all existing rules to the new format.
If you're running in connected mode with SonarQube Server or SonarQube Cloud, you might see the icon which means that there is an AI-generated fix suggestion available. Please check the requirements for using AI CodeFix in your IDE.

An issue’s coding attribute, software qualities, and severity are found when opening the SonarQube Rule tab. Below the rule title, you will find the coding attributes that highlight an issue's classification. Check the glossary for details about coding attributes, and the Software qualities page to better understand how they help classify your issue.

When in Connected Mode
If you’re running SonarQube for IntelliJ while in connected mode with SonarQube Server or SonarQube Community Build, your view will change according to the server settings. Standard Experience mode encompasses the use of rule types such as bugs, code smells, and vulnerabilities. Alternatively, if SonarQube Server is set to Multi-Quality Rule mode, you will more accurately represent the impact an issue has on all software qualities.
Please see the SonarQube Server and SonarQube Community Build articles for detailed information about the available rule modes.
The Log tab
The SonarQube for IntelliJ logs are found here. See the Troubleshooting page to learn how to set the correct log levels when looking for support from the Community.
The Help & Feedback tab
Here, you will find all the quick links you need to access our documentation, reach out to the forum for community support, and find a link to suggest features and impact the future of SonarQube.
At the tooltip
When an issue is selected in the Current File or Report tabs and visible in the Explorer window, you can click the light bulb or hover over the highlighted code to reveal a tooltip description with one or more recommended actions.

As a rule of thumb, most actions provided by SonarQube for IDE are prefixed with the tag "SonarQube for IDE" to distinguish them from actions offered by the IDE.

Was this page helpful?