Injection vulnerabilities
Injection vulnerabilities are also known as injection flaws or taint vulnerabilities; the names are often used interchangeably (ie: injection flaws, injection vulnerabilities, and taint vulnerabilities). They are issues raised by specific security-related rules in SonarQube Server and SonarQube Cloud and remain a top concern. Common types include SQL Injection, Deserialization, and Command Injection vulnerabilities.
Injection vulnerabilities are unique issues because of how data and information flow within your application. This flow becomes a problem when a user controls the data input into the application (source), and that data is not validated or sanitized before it is used by sensitive functions (sink). This lack of validation or sanitization is what allows a potential attacker to manipulate the data flow for malicious purposes.
Because injection vulnerabilities (i.e., taint vulnerabilities) often involve code in multiple files and functions, SonarQube for IDE can only raise them after a full project analysis. This is why taint vulnerabilities are pulled from SonarQube Server or SonarQube Cloud after a project analysis.
You can find the definition of injection vulnerabilities in the SonarQube Server and SonarQube Cloud glossary.
Prerequisites
- The correct solution must be open in Visual Studio and you must be using connected mode with SonarQube Cloud or a SonarQube Server commercial edition. See the pages on Connected mode and Connected mode setup for more details.
- Your project should be analyzed regularly, ideally by your CI server.
Limitations
- Only taint vulnerabilities in open files are shown in the IDE.
- SonarQube for IDE does not support short-lived branches therefore, when running in connected mode with SonarQube Cloud, you must work with long-lived branches; SonarQube Server does not distinguish between long- and short-lived branches.
- SonarQube for Visual Studio follows these methods to choose which branch (in SonarQube (Server, Cloud)) to sync with its local analysis, including the synchronization of taint vulnerabilities in your IDE.
- You’re limited by your SonarQube (Server, Cloud) plan restrictions regarding lines of code limits and branches you can analyze.
How to display taint vulnerabilities
- Set up Connected mode and bind your project to SonarQube (Server, Cloud).
- SonarQube for Visual Studio will sync the taint vulnerabilities from the configured server.
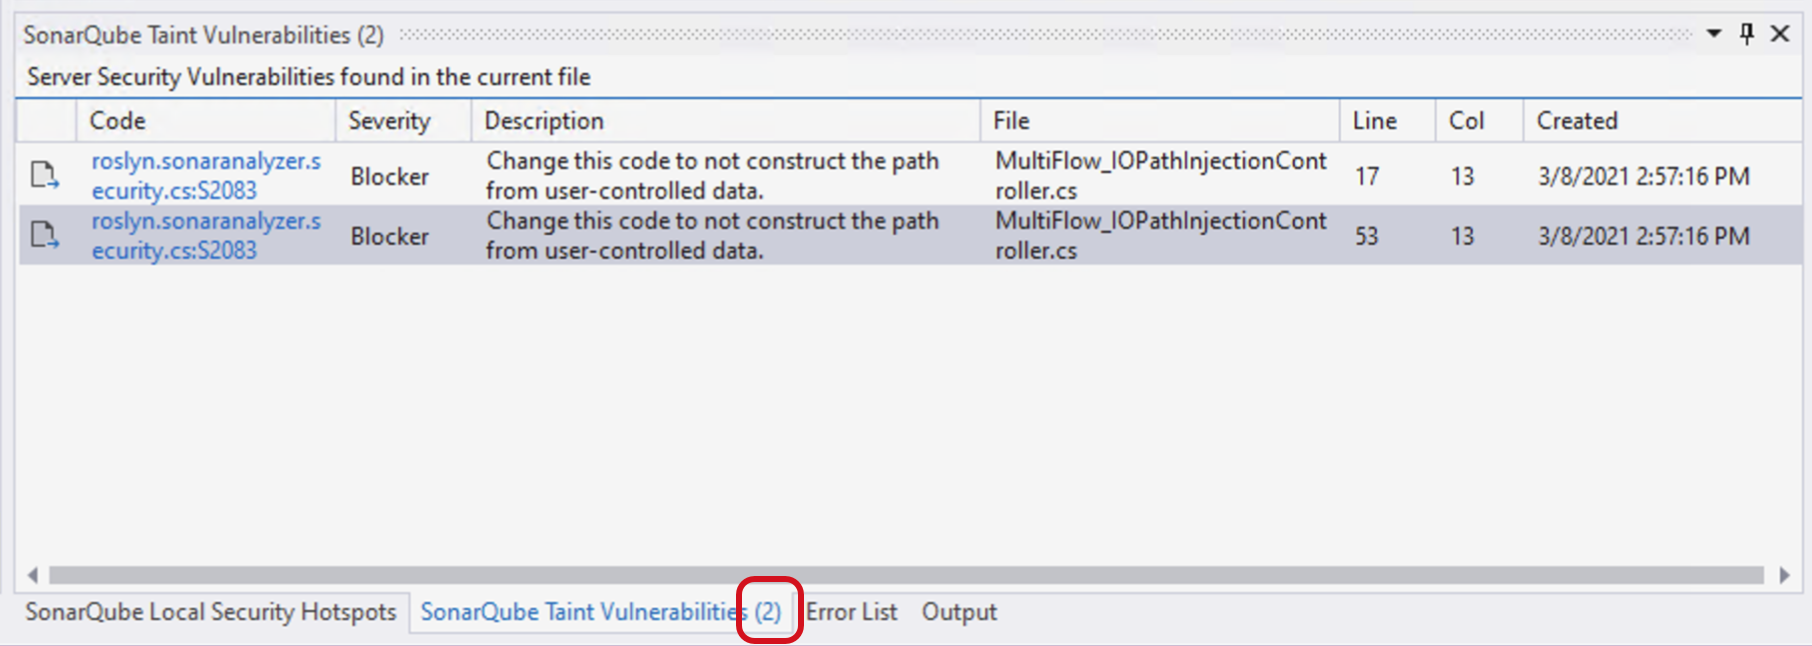
- If any vulnerabilities exist, the SonarQube Taint Vulnerabilities tool window will be displayed in a new tab next to the Error List:
The tool window will appear automatically if your server has any taint vulnerabilities in your project. If you are not in connected mode, or if your server has no taint vulnerabilities, the window will not appear.
When viewing a taint vulnerability on the SonarQube (Server, Cloud), it's possible to use Open in IDE button to jump to the issue in SonarQube for Visual Studio. See the Opening issues in the IDE article for full details.
Taint Vulnerabilities list
The SonarQube Taint Vulnerabilities list is filtered to display remote taint vulnerabilities found in the currently open file. When a file containing taint vulnerabilities is opened, the caption of the tool window will update to reflect the number of remote taint vulnerabilities found in the file:

Currently, SonarQube for Visual Studio does not detect injection vulnerabilities during live analysis in the IDE. The issues appearing in the Taint Vulnerabilities list are the issues reported in SonarQube (Server, Cloud).
Investigating injection vulnerabilities
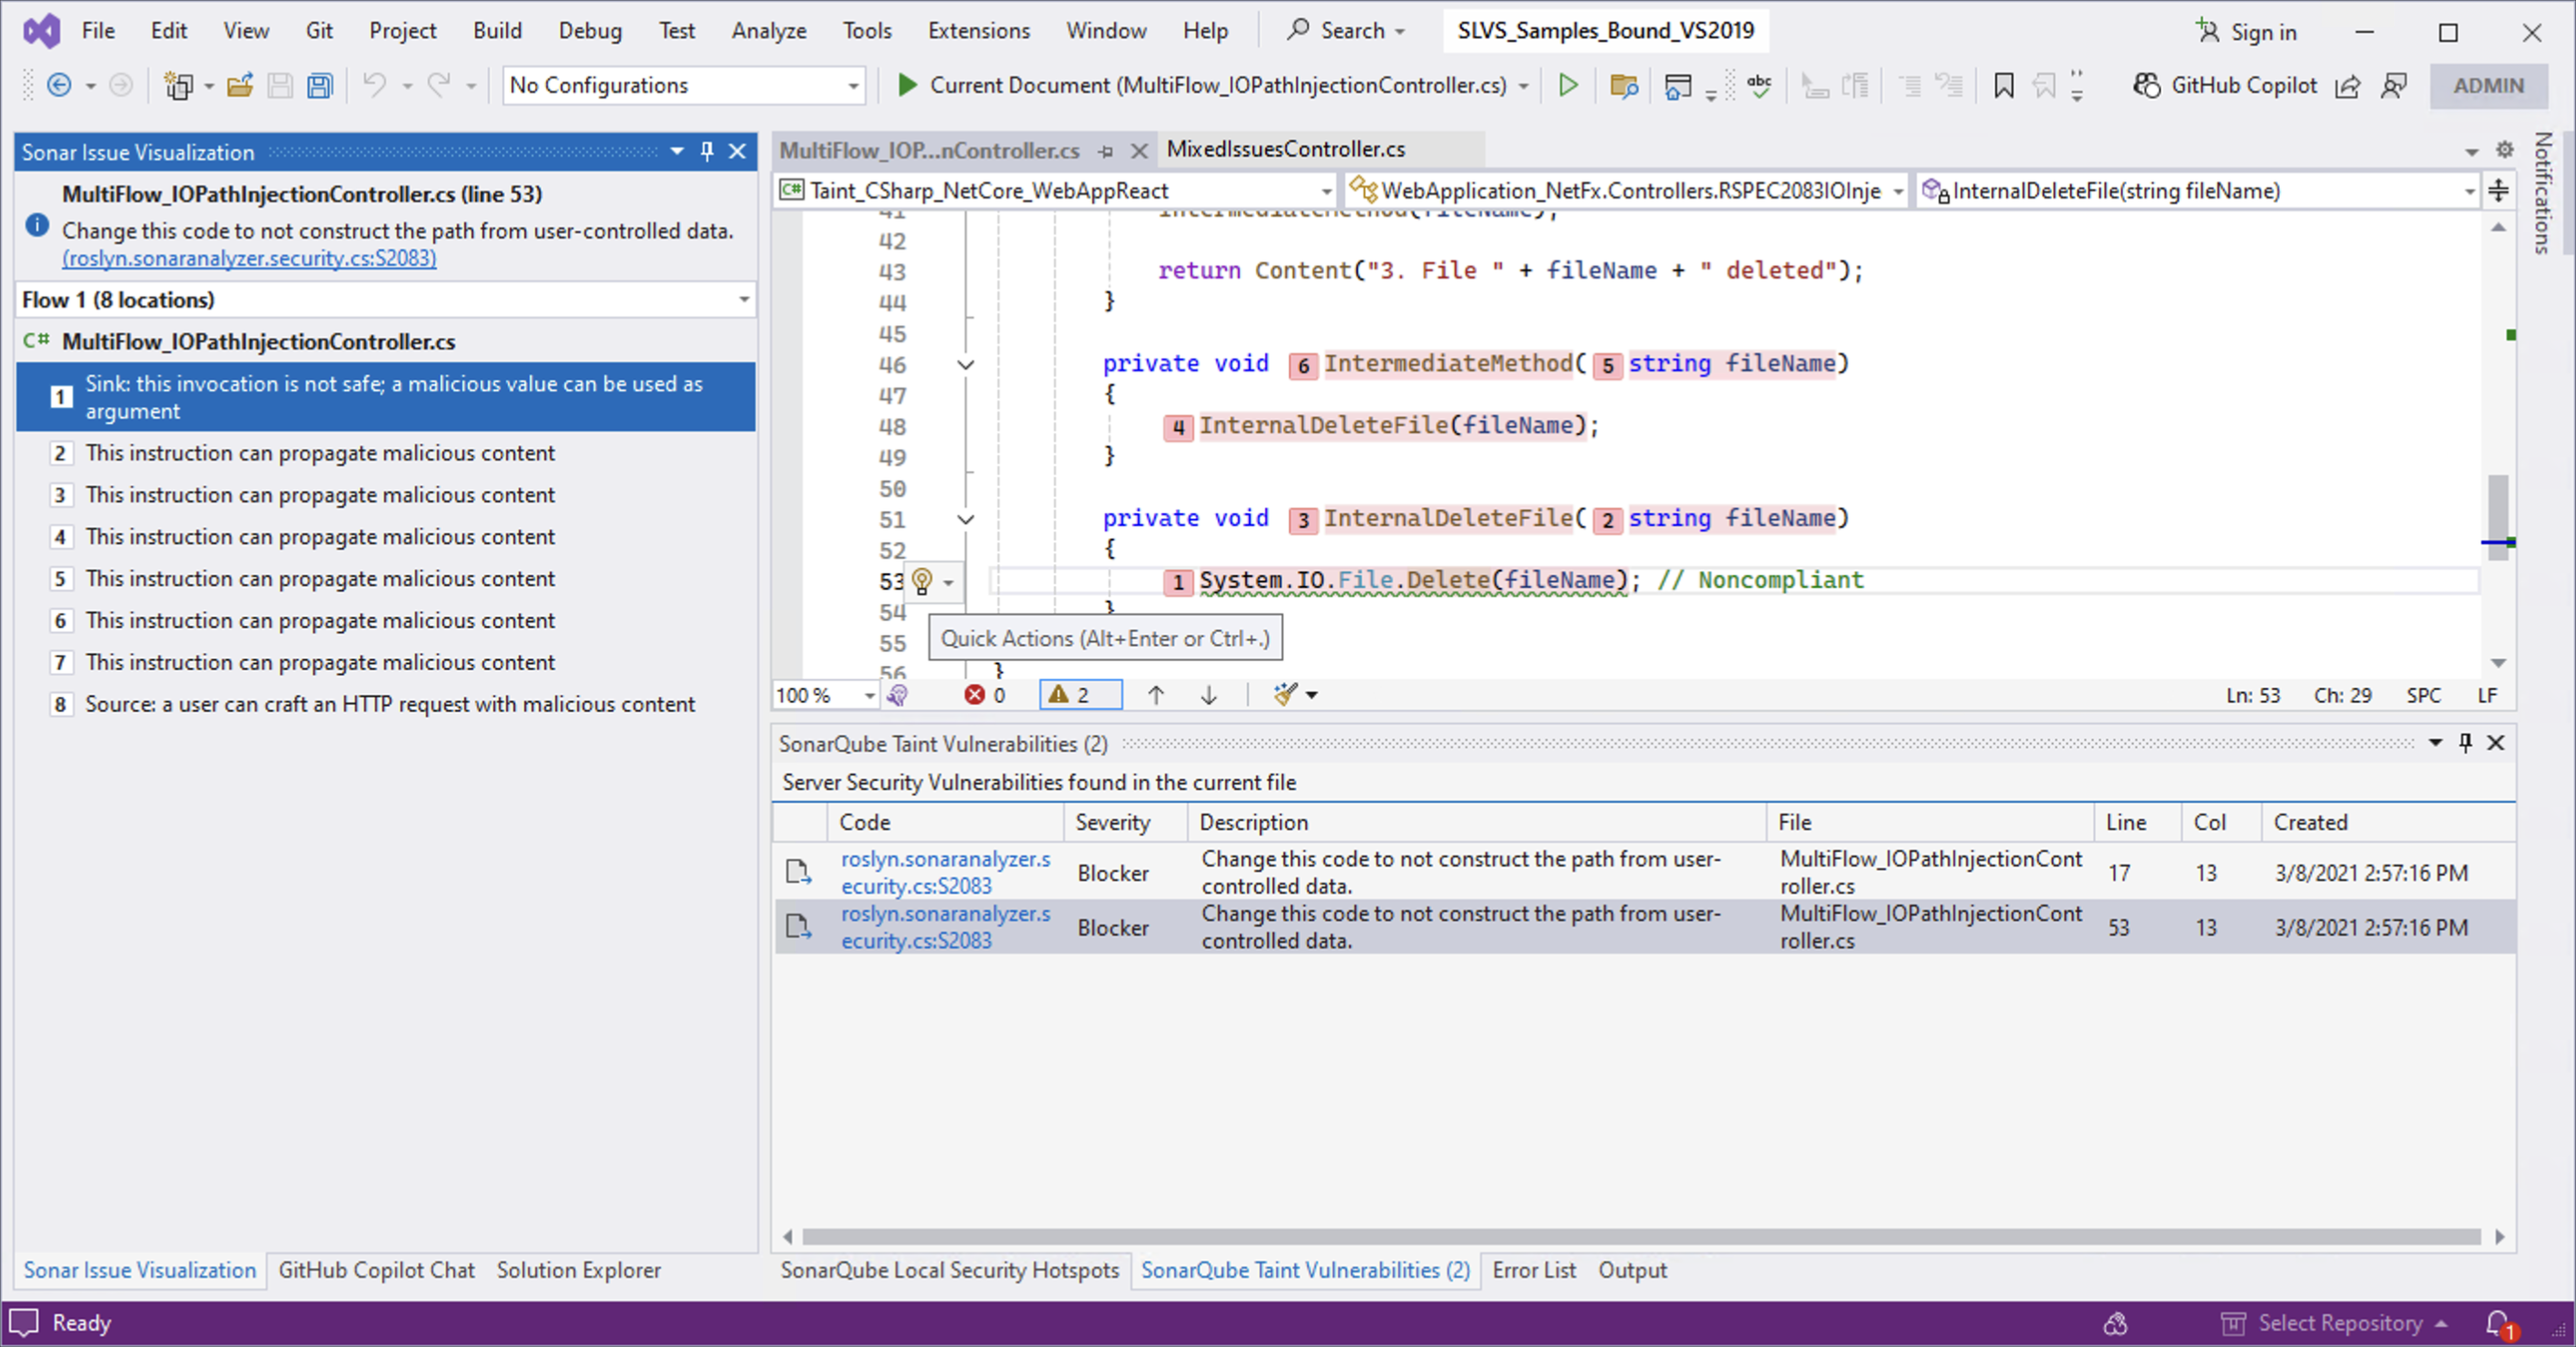
You can investigate a vulnerability by double-clicking the issue, or selecting the issue and press Enter. This will take you to the relevant code location and open the SonarQube for Visual Studio Issue Visualization panel with a visualization of your code flow.

If you do not see the Issue Visualization panel, go to Extensions > SonarQube > Show Issue Visualization. For more information, see the documentation on Investigating issues.
Non-navigable code locations
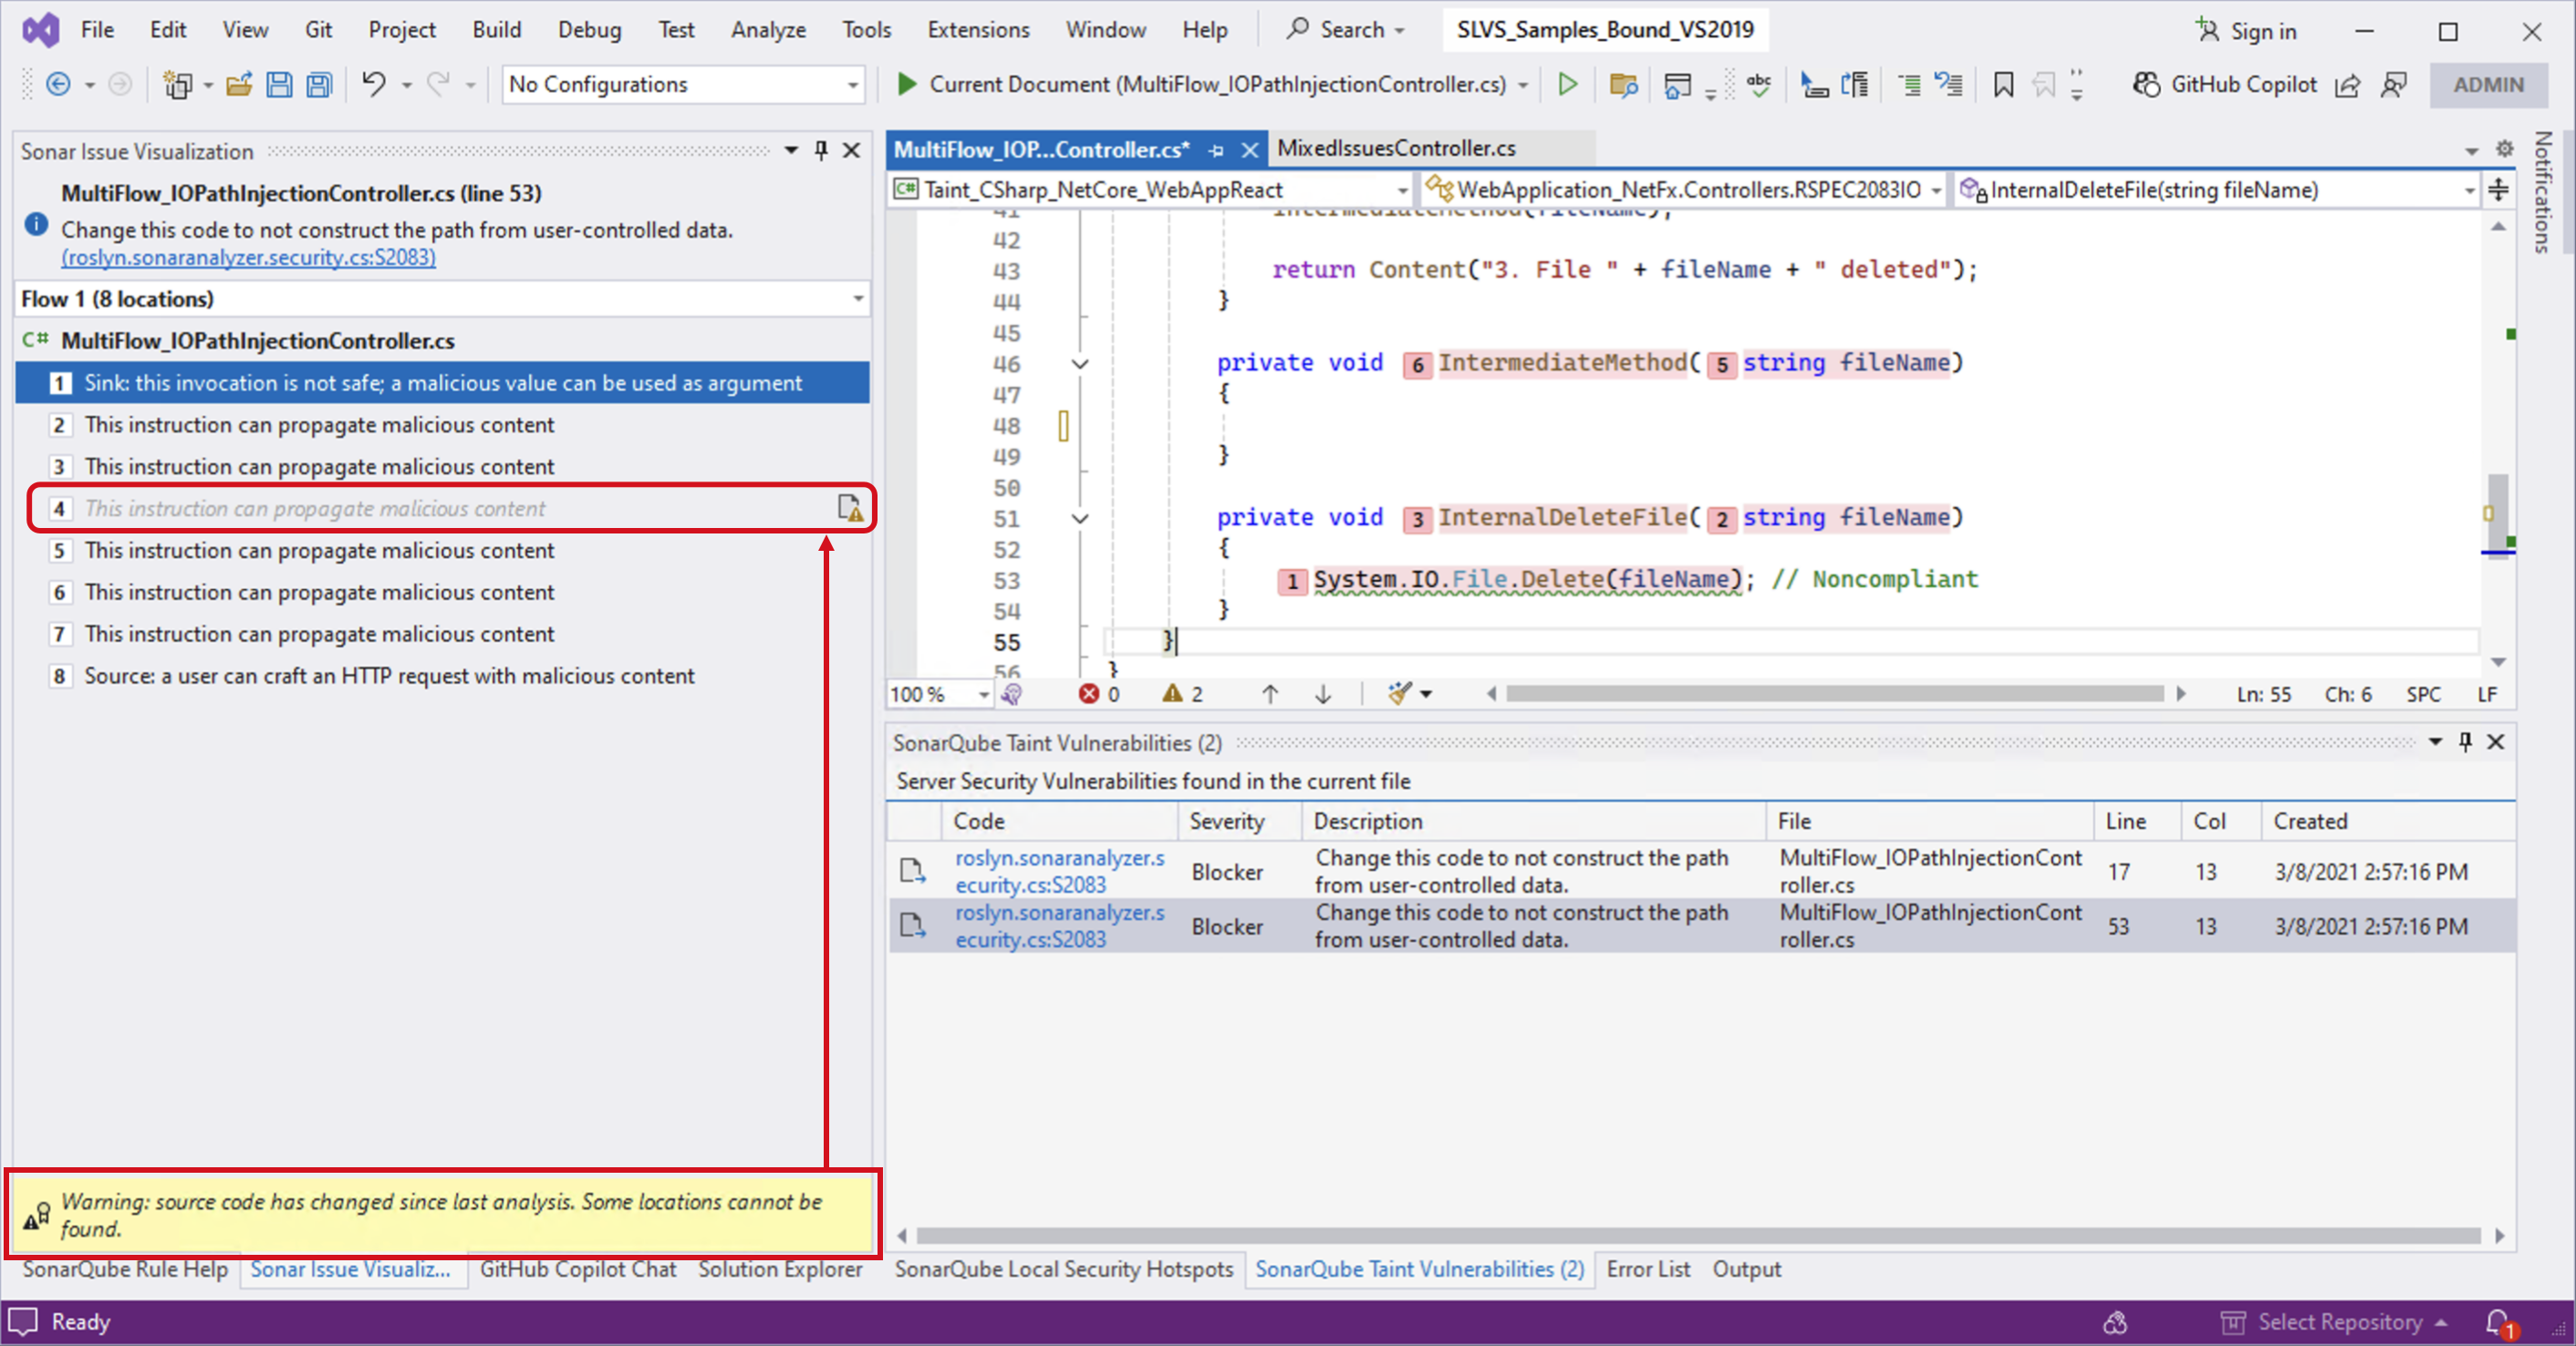
Because taint vulnerabilities are fetched from the SonarQube (Server, Cloud), it is possible that the code on your server does not match your local code version, e.g. if code changes have been made since the last analysis. In this case, non-navigable locations will be displayed with an indication that they are not navigable:

Manually re-opening SonarQube Taint Vulnerabilities tool window
If you manually close the tool window, it will no longer appear and disappear automatically when a solution is opened. You can show the window again by clicking on Extensions > SonarQube > Connected Mode > View Taint Vulnerabilities.
How to fix your taint vulnerabilities
Because the detection of taint vulnerabilities requires that you run in connected mode, any changes you make to the code must be analyzed by your instance of SonarQube (Server, Cloud). Here are two options to resolve taint vulnerabilities displayed by SonarQube for IDE:
- After you fix the taint vulnerability in your IDE, commit your code to the server and rerun the analysis on SonarQube (Server, Cloud). The new status (of the vulnerability) will be reflected in your IDE.
- Go to the issue in SonarQube (Server, Cloud) and mark it as Accept or False positive. The new status will be updated locally in less than one minute.
When running in connected mode with SonarQube Server 10.4 or newer, Won’t Fix becomes Accept.
See the Fixing issues page for complete details about fixing issues, including injection and taint vulnerabilities, in SonarQube for Visual Studio.
Was this page helpful?