Fixing issues
On this page
Whether your issue is about a potential security problem, considered to be a bad coding practice, or a more serious logic error, fixing issues usually involves changes to the code. SonarQube for IDE’s issue messages contain useful information about how to fix the potential problem and include a rule description so that you can learn more about why the issue is reported.
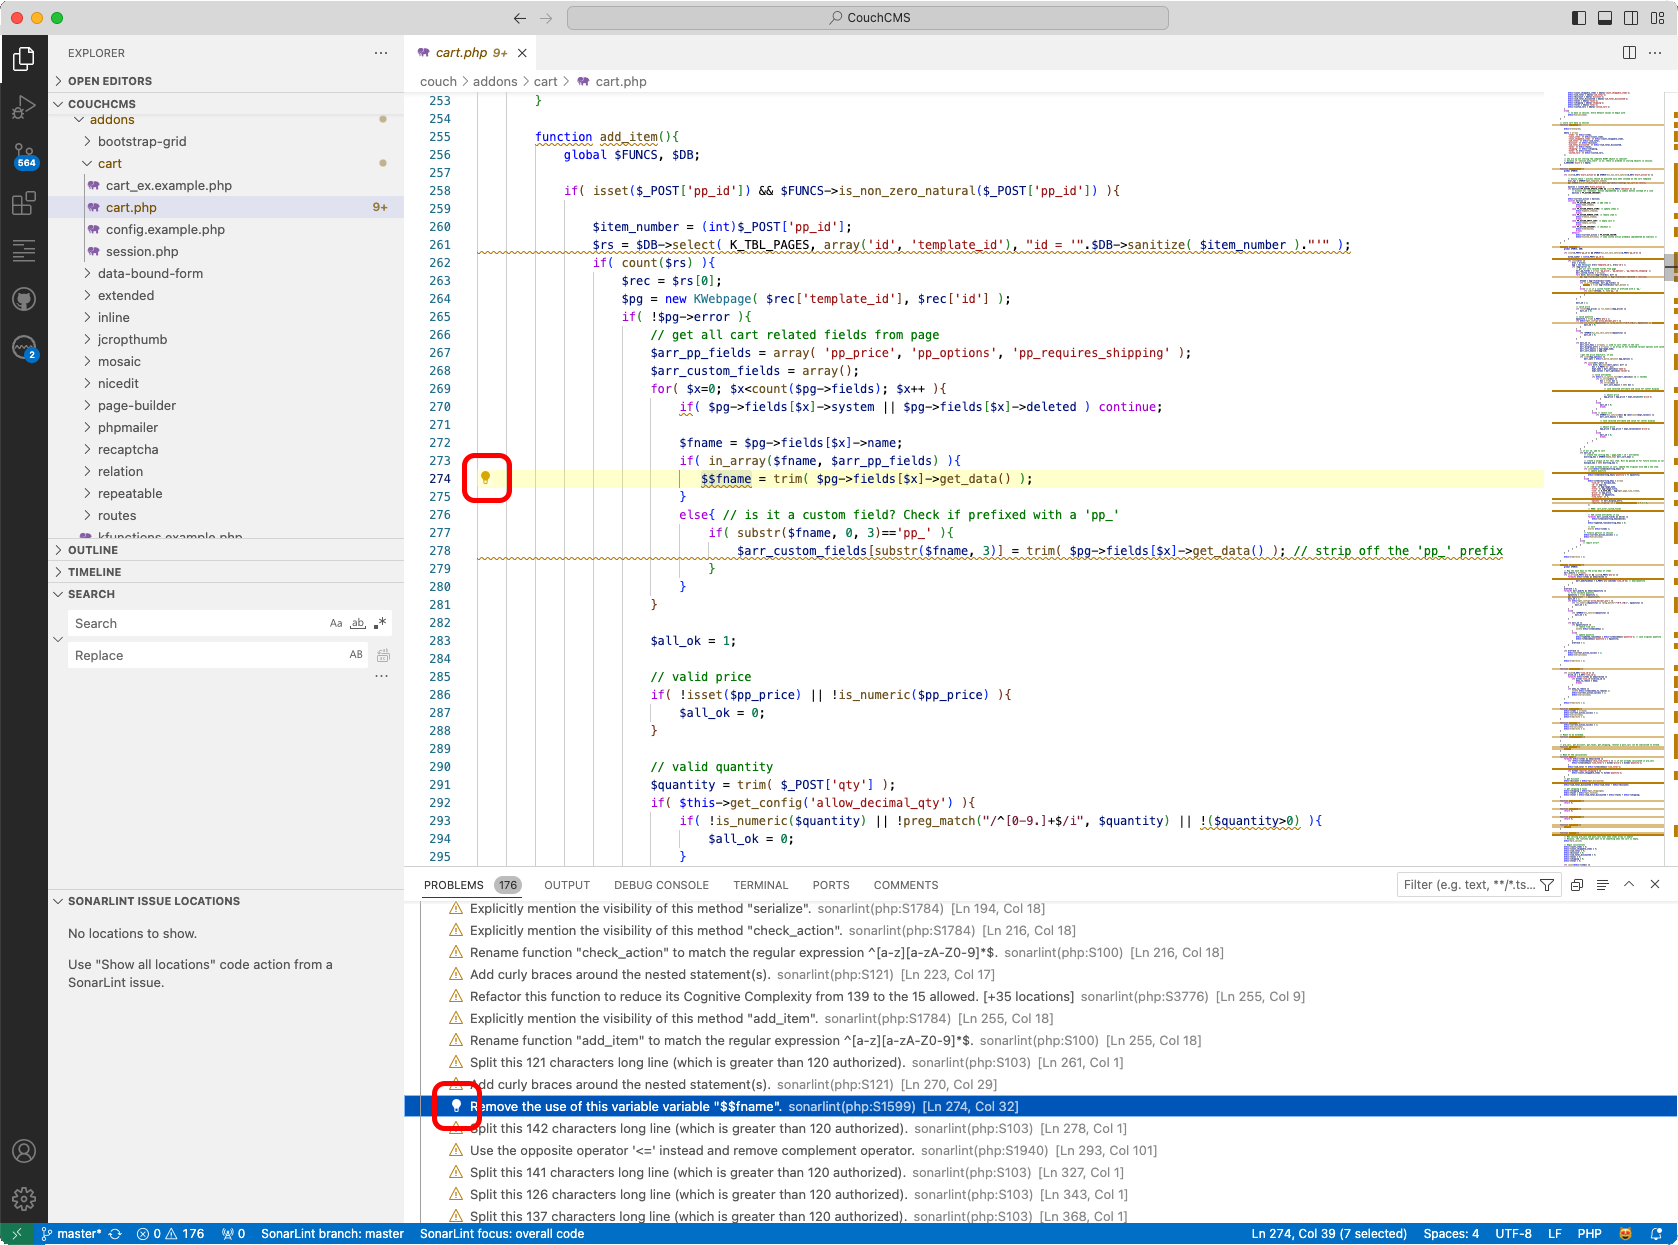
SonarQube for VS Code offers multiple ways to Investigate issues and fix problems in your code. Issues reported by the analyzer exhibit the following code actions, found by selecting an issue in the PROBLEMS panel and clicking on its lightbulb (in either the PROBLEMS panel or in the code editor).
Quick fixes
Some issues have Sonar Quick Fixes which means that with a single click, SonarQube for IDE will automatically edit your source code to comply with the rule description and fix the issue. Even when a Sonar Quick Fix is not available, SonarQube for IDE provides options in the tooltip to help you fix your code.
While in the explorer window, select the issue in the SonartLint View window or click the lightbulb in the left margin to reveal the tooltip exposing one or more of these options:
- Open description of rule: opens a new view panel with the detailed rule description, which usually explains why the issue is raised and explains how to fix it.
- Show all locations for issue: opens the SONARQUBE ISSUE LOCATIONS view panel and highlights additional locations of this issue.
- Deactivate rule ‘yyy:XXX’: This action disables the rule in the user’s VSCode settings and is only available when you are not using Connected Mode.
- To reactivate a rule, go to the SONARQUBE > RULES view in VS Code and click the 3-dots to select Find Rule By Key.

If your code violates more than one rule, a set of options will be presented for each instance. An example is shown in the image below.
- SonarQube for VS Code calls out that your container is missing both CPU and memory limits with rules kubernetes:S6869 and kubernetes:S6864; the Maintainability and Security of your code is potentially affected.

Fixing injection vulnerabilities
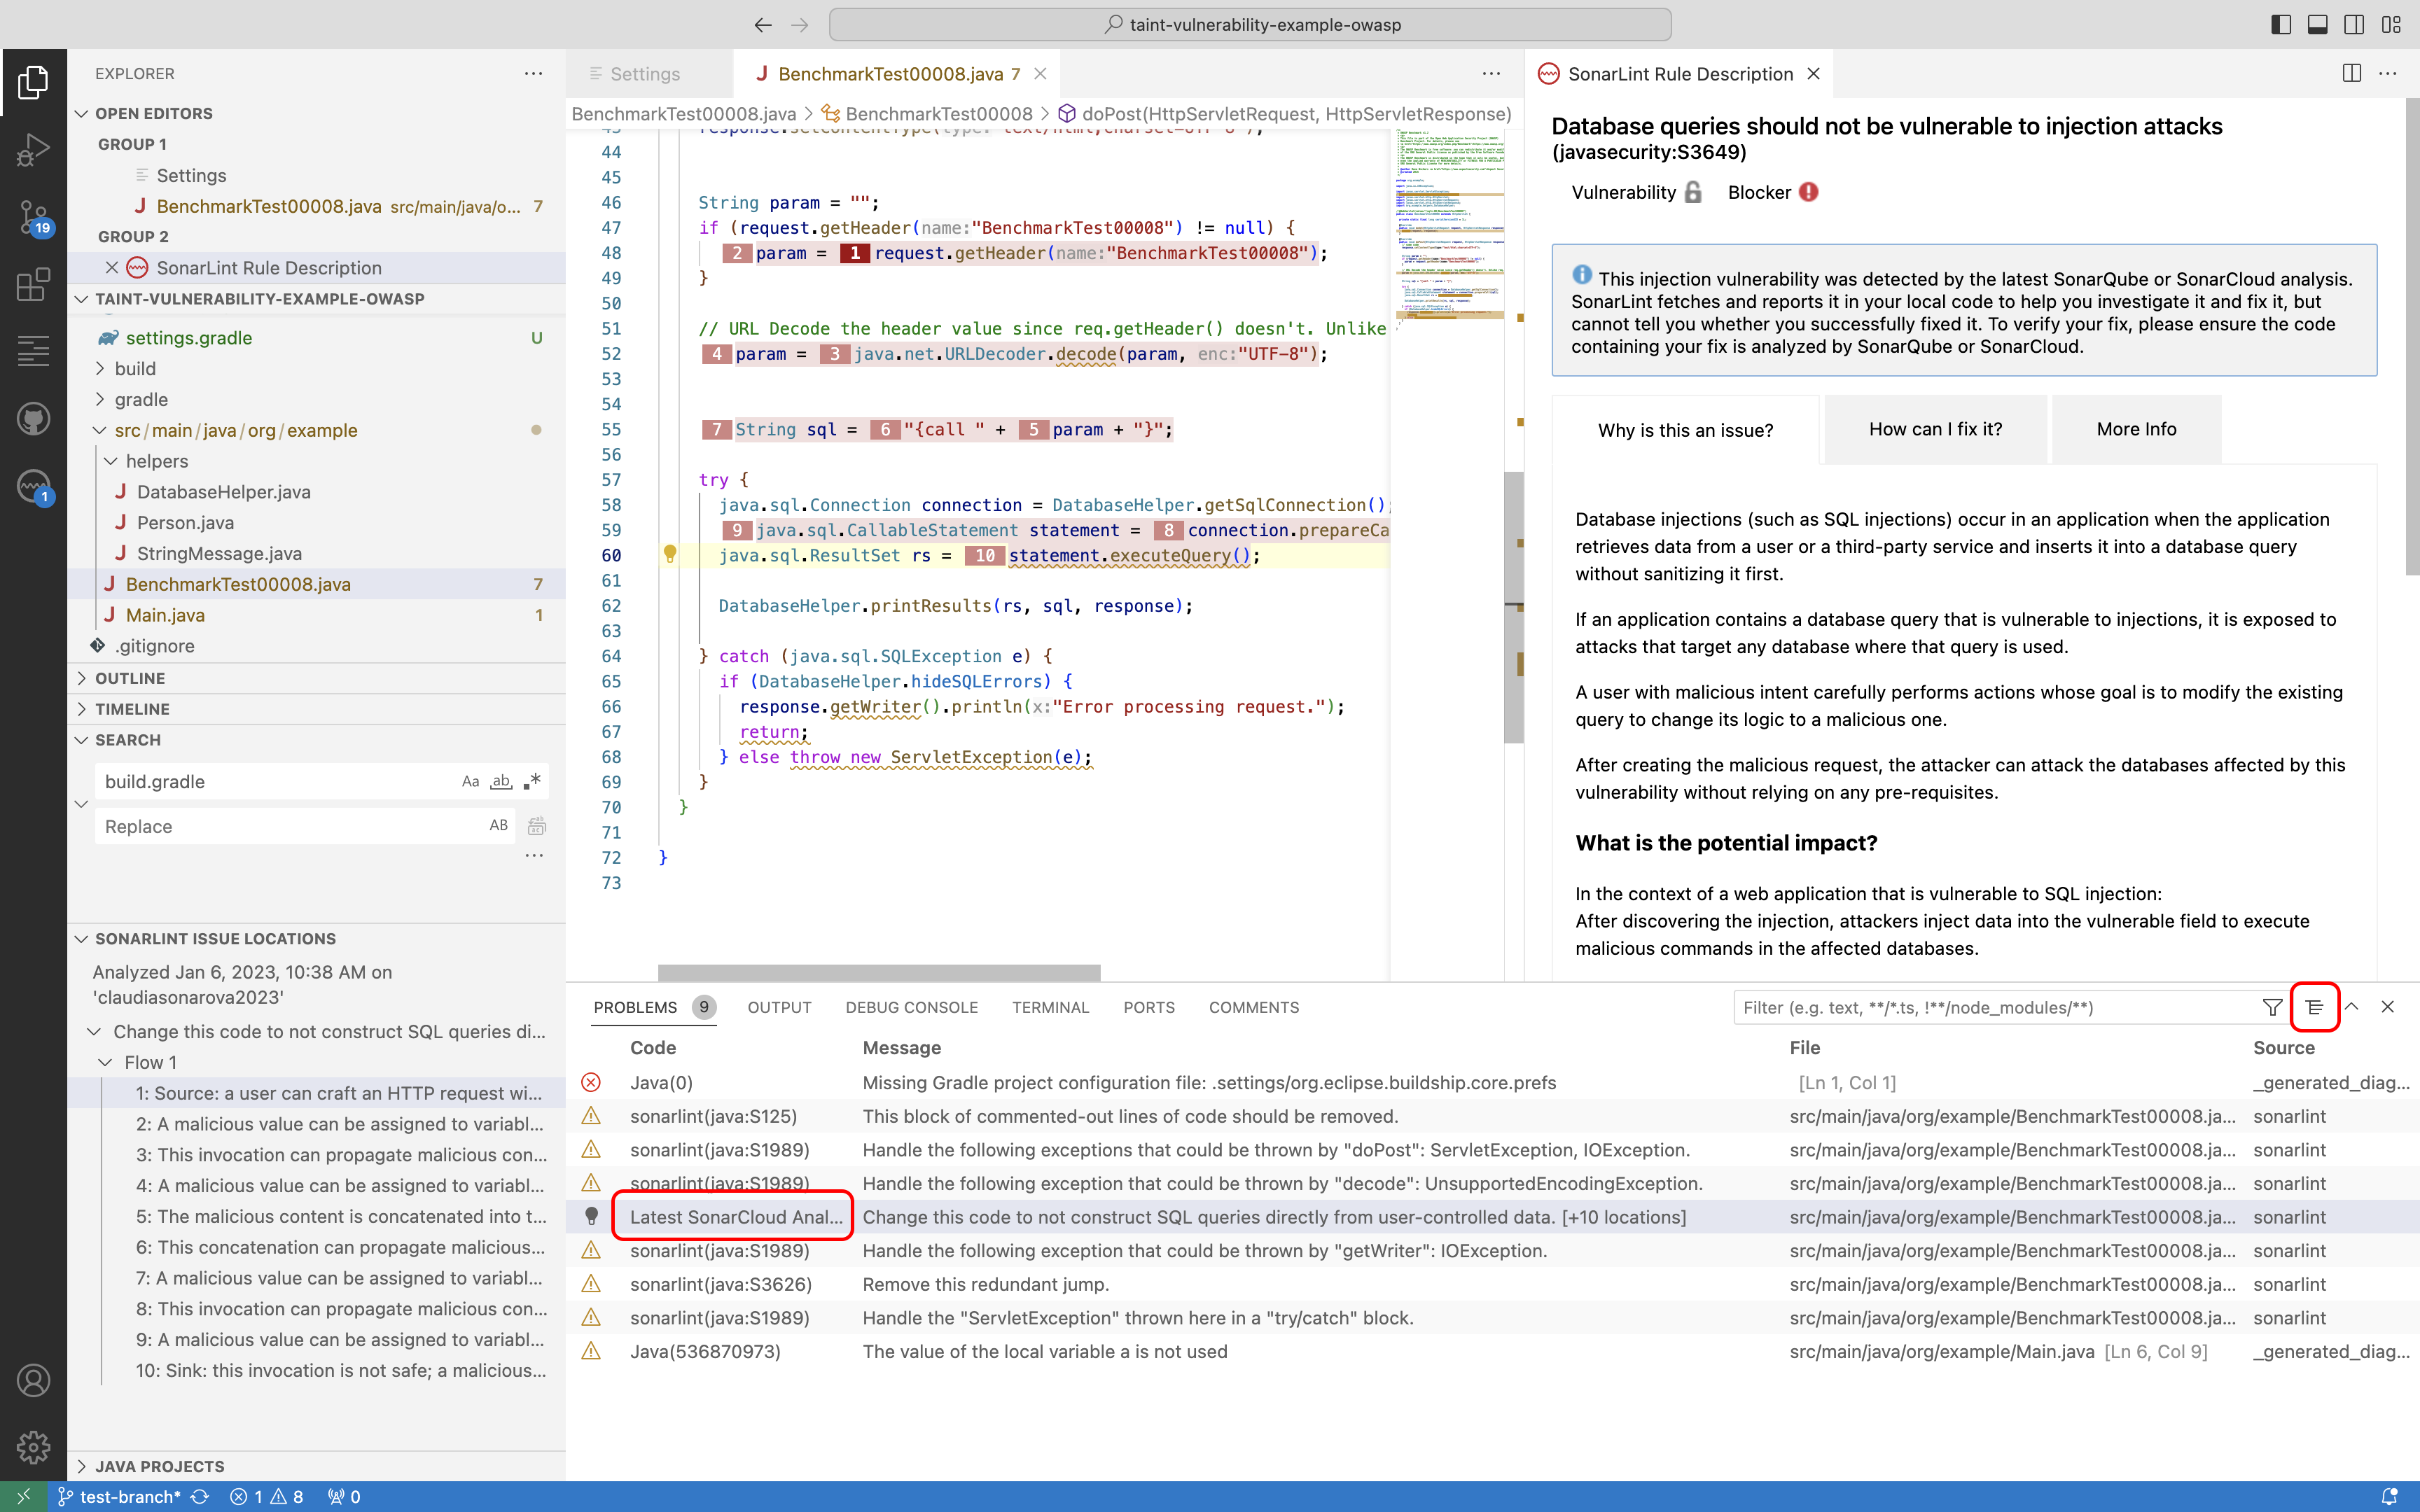
Injection vulnerabilities (also called taint vulnerabilities) are security-related rule issues that are only raised by SonarQube Server and SonarQube Cloud. Due to technical limitations, SonarQube for VS Code can not raise such issues on local analysis and must be running in Connected mode to sync injection vulnerabilities from the server.
Injection vulnerabilities are distinguished in the PROBLEMS panel with the Latest SonarQube Server/SonarCloud Analysis tag as shown in the following image:

Learn how to fix your injection vulnerability by opening the tooltip options. Click on the issue’s lightbulb or right-click on the issue shown to select one of the following:
- Open description of rule ‘your rule‘: to learn why it is an issue.
- Show all locations for taint vulnerability ‘your rule’: to see the issue’s execution flow from the source to destination sinks (user-controlled inputs to sensitive functions).
- Open taint vulnerability ‘your rule’ on ‘your server’: where you can learn more about why this is an issue.
Please see the documentation about Injection vulnerabilities for more information about working with these particular security issues.
Marking issues
When running SonarQube for VS Code in connected mode with SonarQube Server 10.2 and newer, it is possible to mark issues before submitting your code for PR analysis.
To mark an issue, go to your issue in the code editor and select the lightbulb to find the More Actions… menu. Then select SonarQube: Resolve issue violating rule `<your rule>` and choose either Won’t fix or False positive to resolve the new issue. Note that the More Actions… menu is not available from the PROBLEMS panel.
When running in connected mode with SonarQube Server 10.4 or newer, Won’t Fix becomes Accept.
Marking an issue can be applied to both new issues and known issues. Marks made on known issues will be reflected on the SonarQube Server server within a few minutes; marks made on new issues will be reflected on the server when a new analysis is run. The option to mark an issue as resolved will not appear if you are connected to an unsupported version of SonarQube (Server, Cloud).
To unmark all issues not yet known in SonarQube Server, open the VS Code Command Palette and run the command SonarQube for IDE: Reopen Local Issues for current file. This command will only affect new issues that were marked before an analysis was run on the server.
Requirements for marking issues
- SonarQube for VS Code 3.21 or newer.
- Running in connected mode with SonarQube Server 10.2 or newer (Marking issues while bound to a project in SonarQube Cloud is not supported by SonarQube for VS Code 3.21).
- In SonarQube Server, the Administer Issues permission must be granted to the user(s).
This feature is not supported for security hotspots and injection vulnerabilities. Please see the dedicated documentation for fixing each of those each issue types.
Was this page helpful?