Investigating issues
SonarQube for IDE can help developers by letting them perform local analyses to check their code before pushing it back to the SCM. While running an analysis, SonarQube for IDE raises an issue every time a piece of code breaks a coding rule.
Usually, a first analysis is performed as soon as one of the supported files is opened. Then, regular analyses are triggered when the editor content changes and/or when the file is saved.
This page describes how to find and investigate issues in your IDE.
Defining issues
An Issue is a problem in your code that prevents it from being Clean Code. Issues found in code are linked to Clean Code attributes, and these attributes signify how your code will impact one or more software qualities. Software qualities determine the overall severity of an issue that feeds back into the overall status of your code when implementing a Clean as You Code methodology; please see the SonarQube Server or SonarQube Cloud documentation for more about Clean as You Code.
Each issue is linked to one Clean Code attribute which is associated with one or more software qualities, each with a level of severity. Please check the Clean Code benefits page on software qualities for more information.
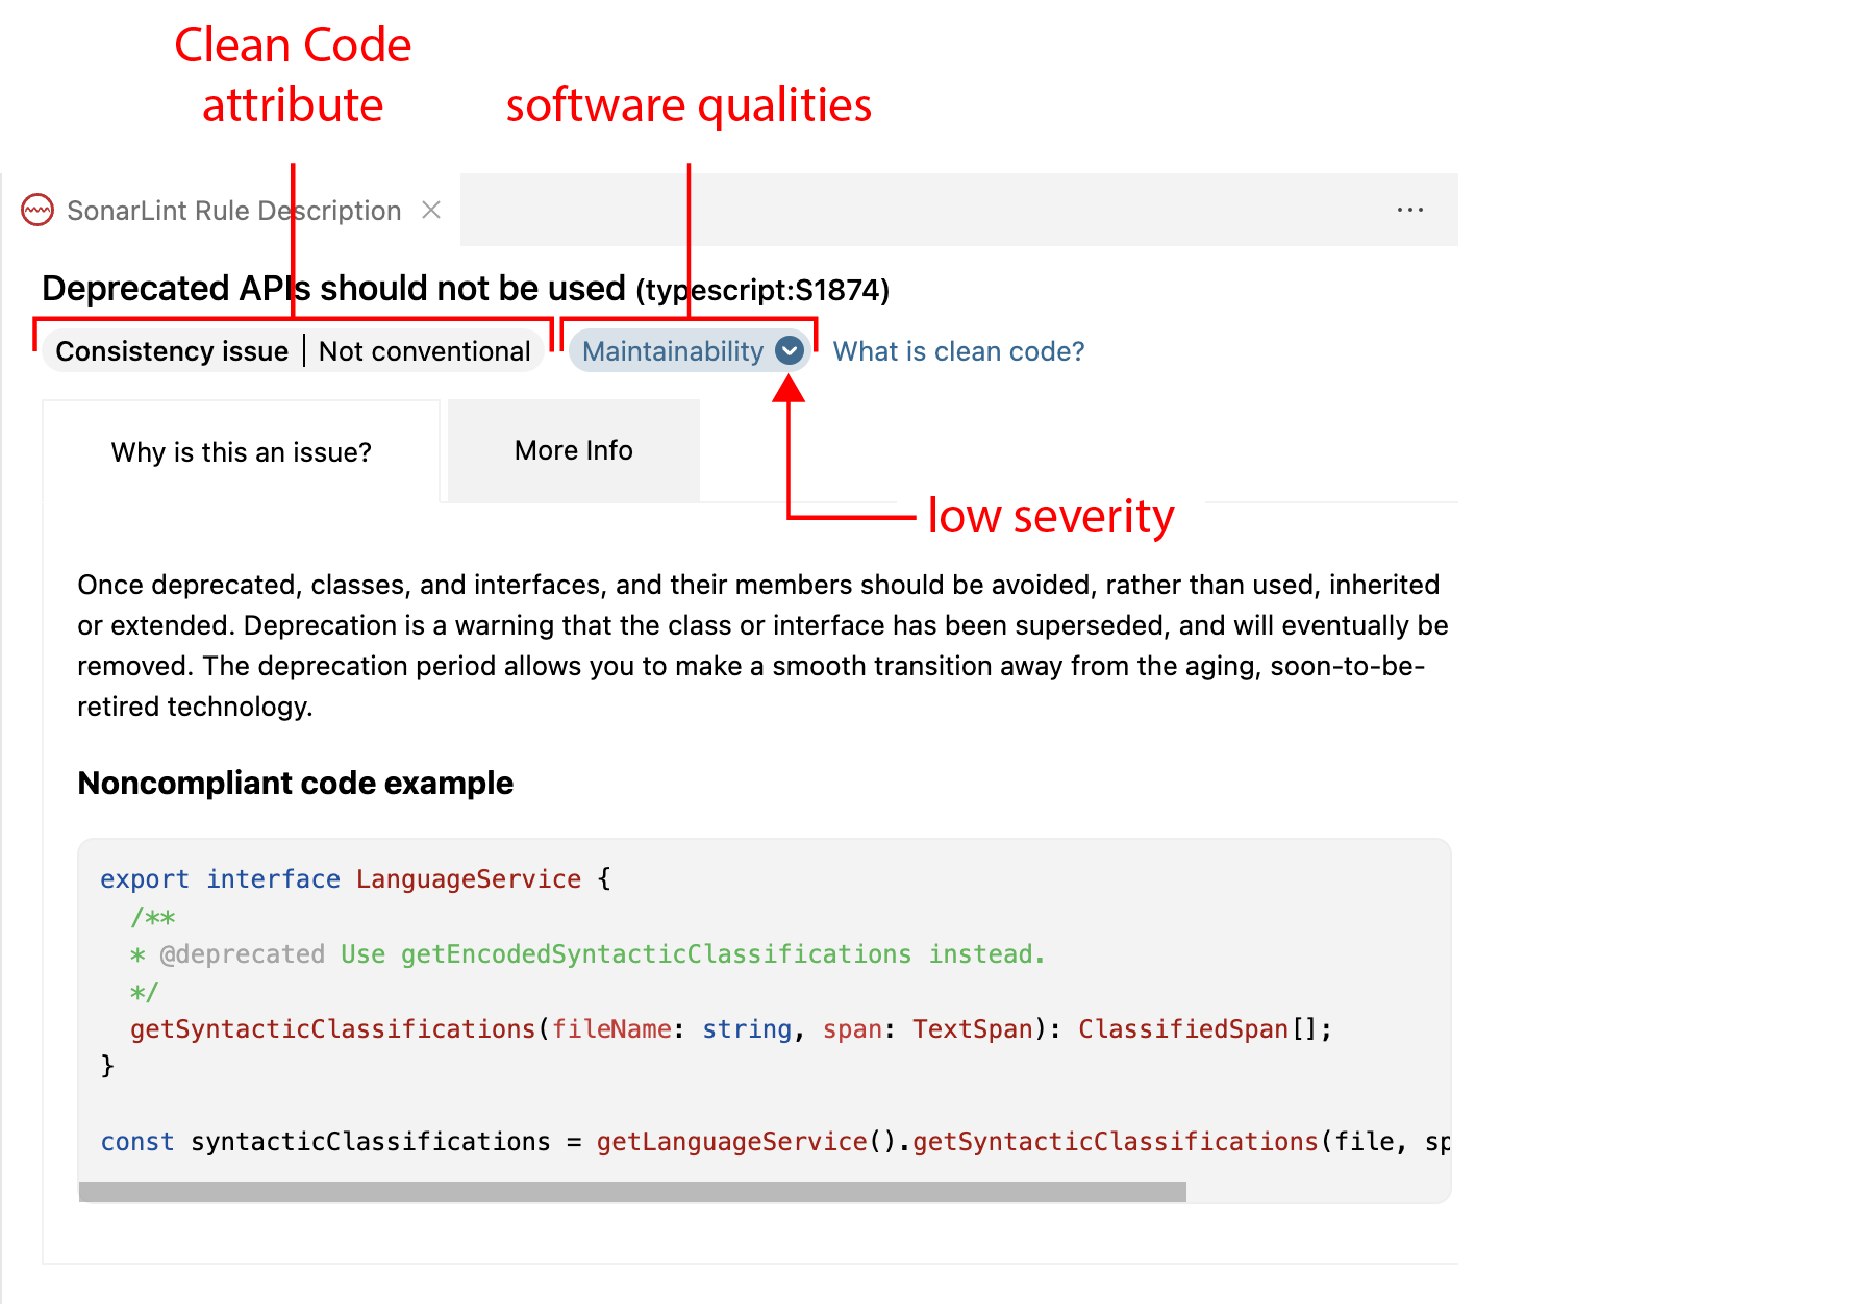
To communicate the code attributes, software qualities, and severity of issues found in your code, SonarQube for VS Code displays them in the SonarQube Rule Description webview as described below.
Finding issues
For most issues, SonarQube for VS Code provides information about why there is an issue and offers one or more actions to Fix your issue. Issues can be found in 3 places:
- In the VS Code Text Editor, identifiable by the classic squiggles underlining issues in the code.
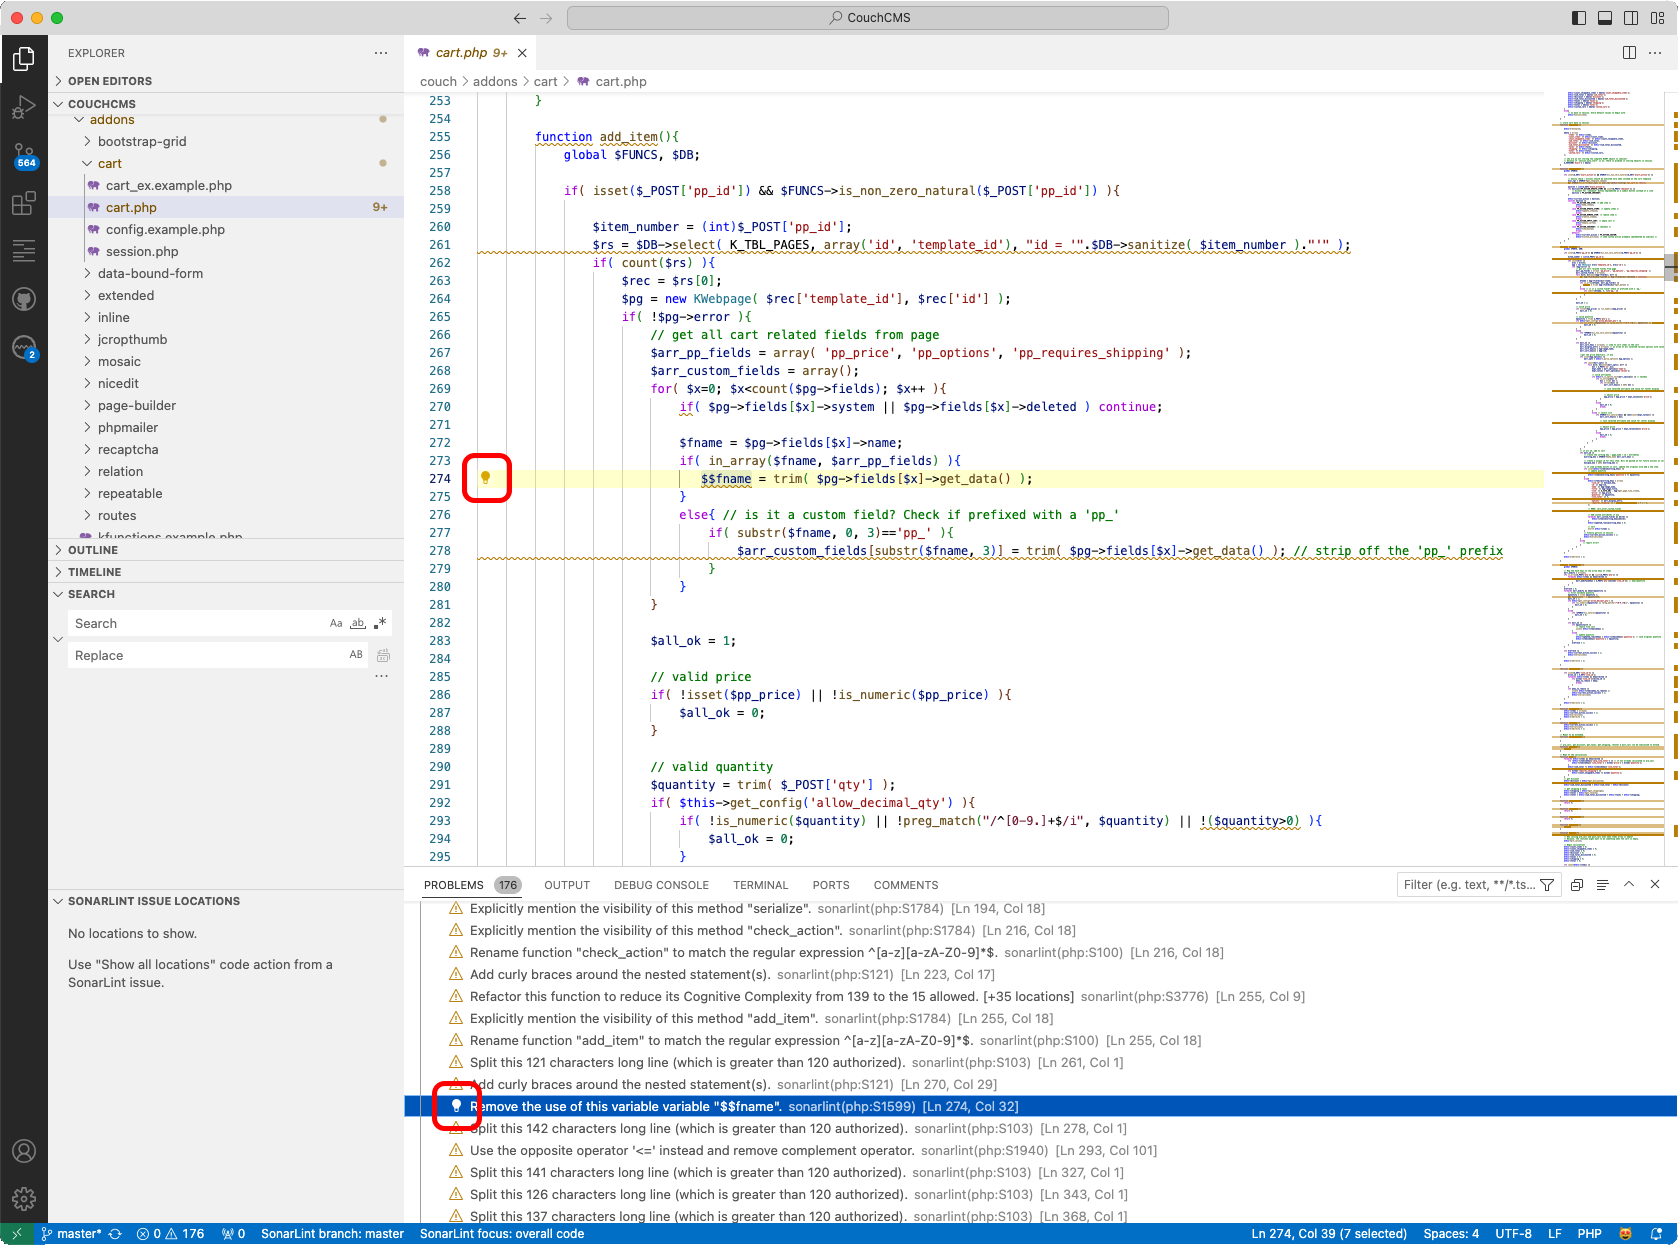
- In the Tooltip, recommended action(s) can be found by clicking on the light bulb in the left margin of the code explorer view.
- In the PROBLEMS panel, select your issue to highlight the issue-causing code in the Editor. Right-clicking on the issue opens the same tooltip action as described above.
Security hotspots are found in the SONARQUBE > SECURITY HOTSPOTS view panel. See the Security hotspots page for more details.
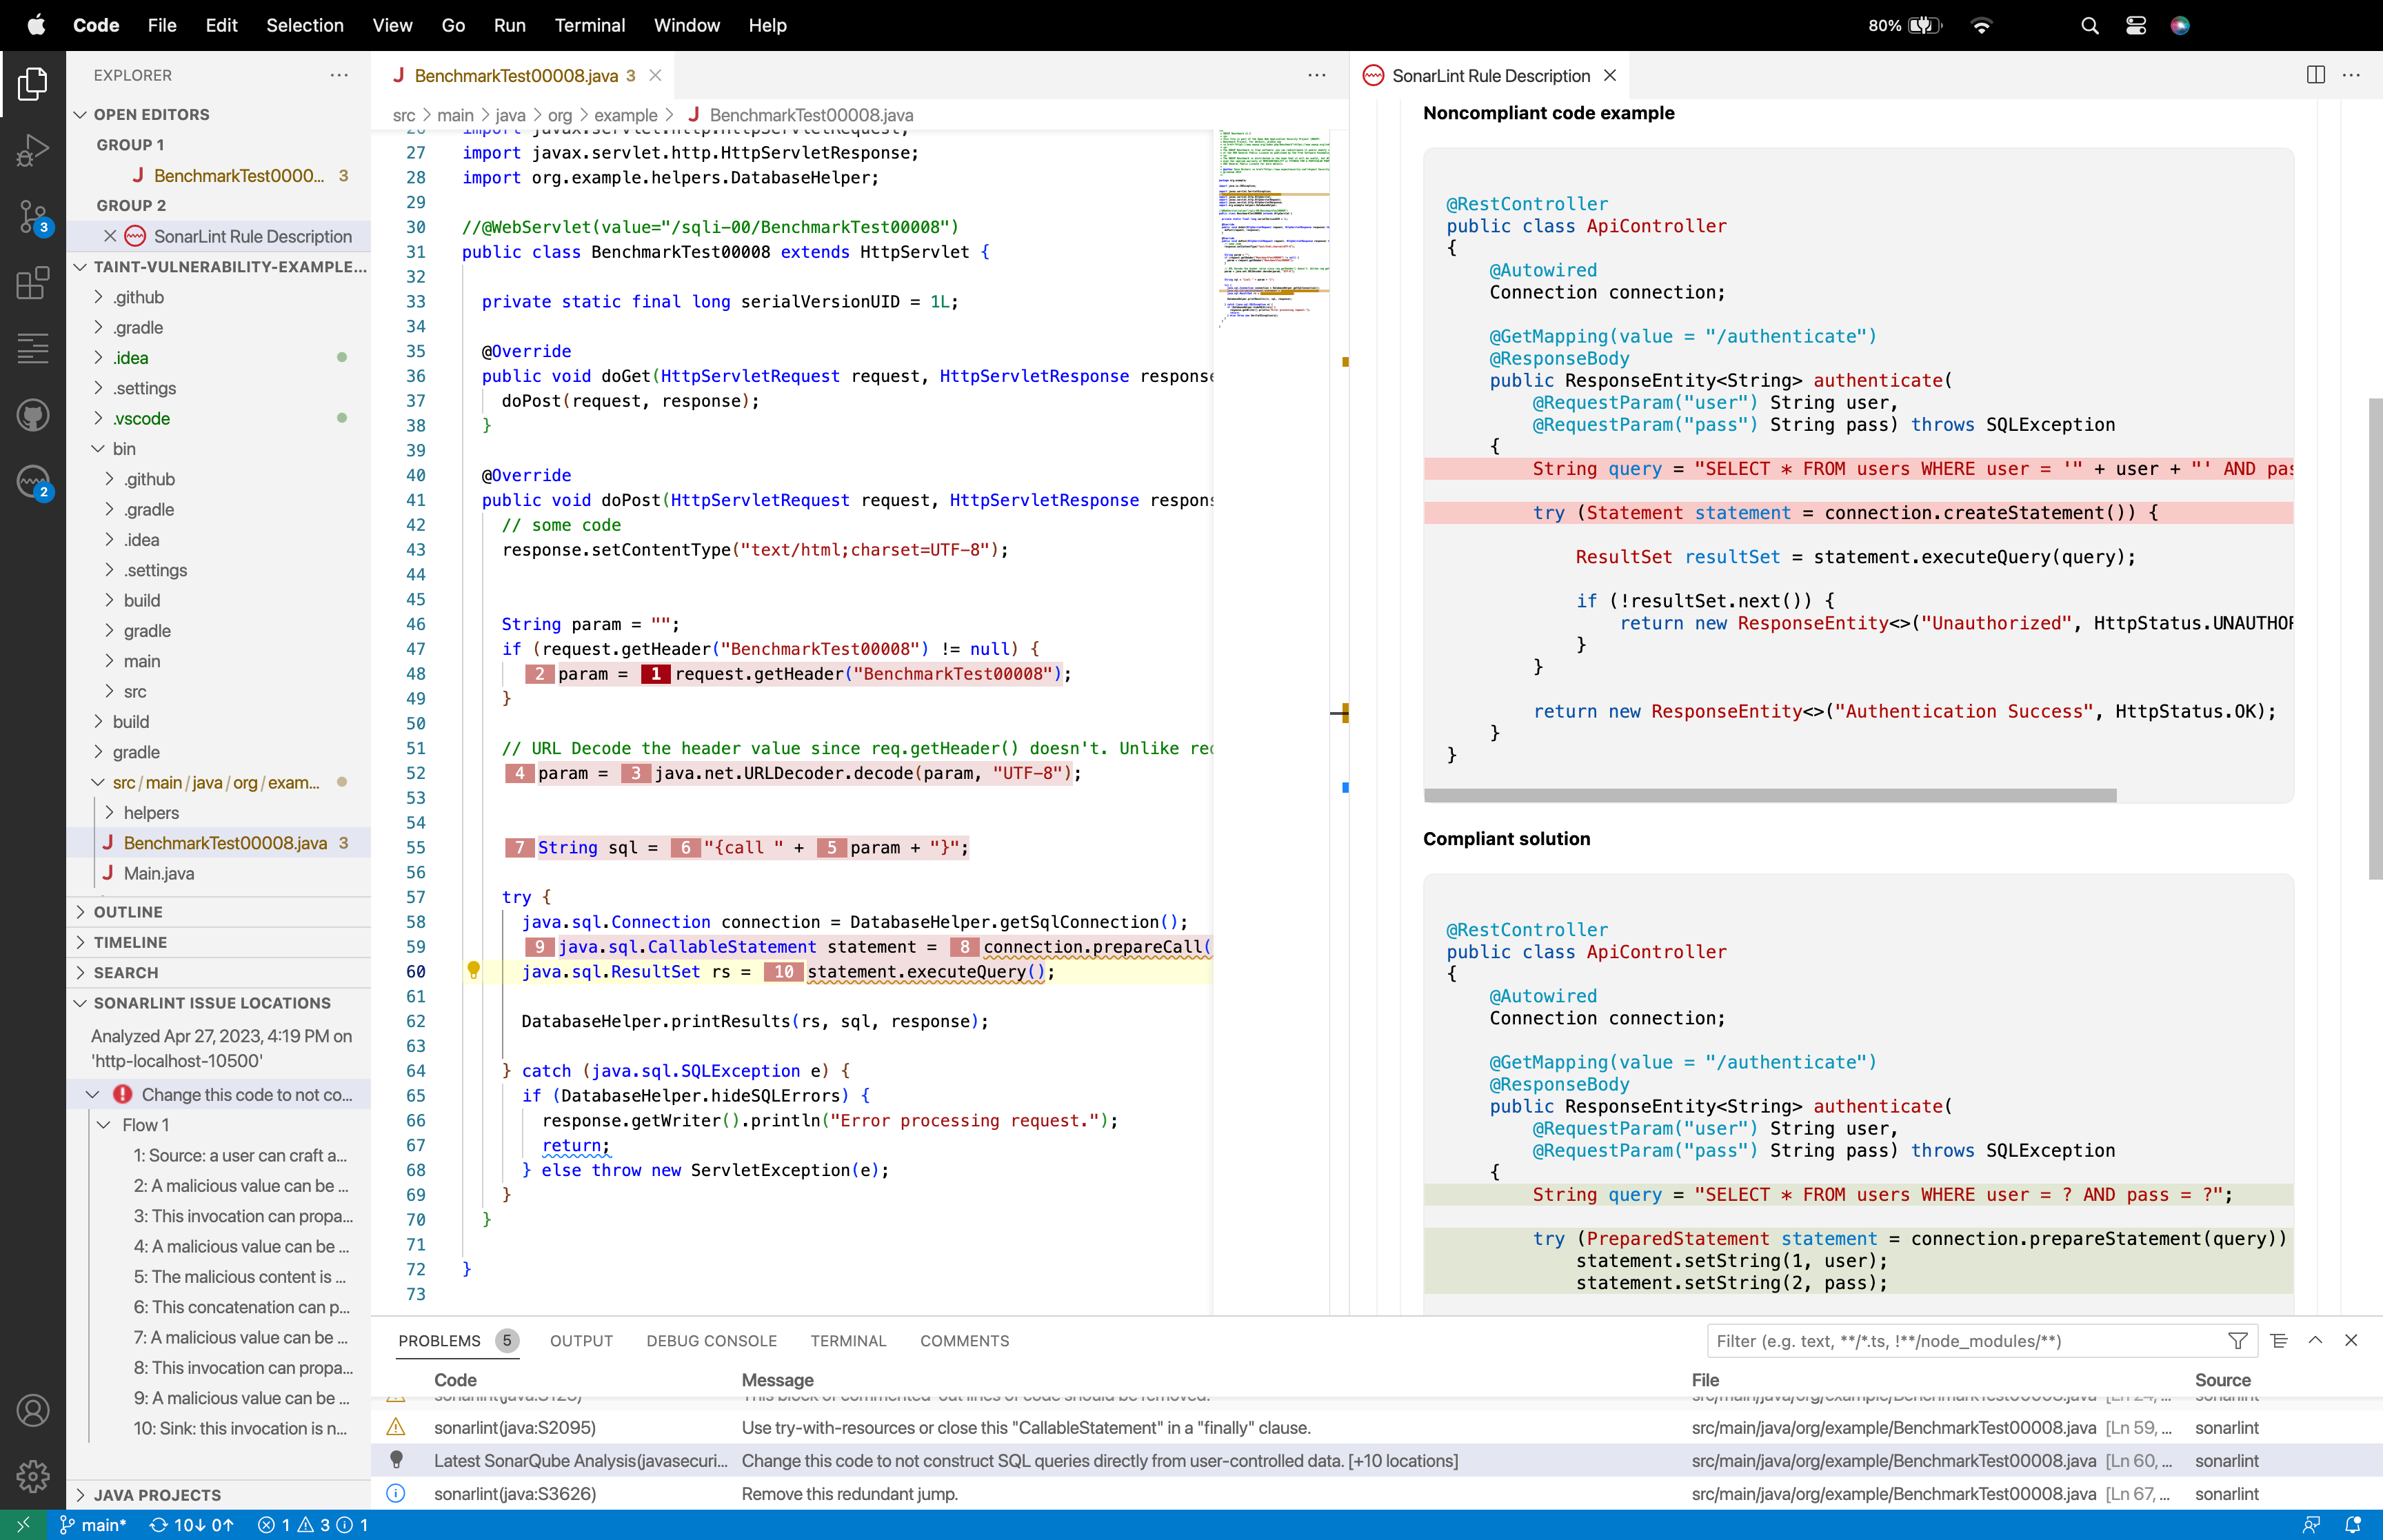
Injection vulnerabilities work a bit differently. At the Tooltip, select Show all locations to view the execution flow in the SONARQUBE ISSUE LOCATIONS view container. See the Injection vulnerabilities page for more details.
Opening issues in the IDE
Understanding issues in context is a helpful way to address problems more effectively. Beginning in SonarQube Server 10.3, on SonarQube Cloud, and in SonarQube Community Build, it is possible to open all issues in your IDE, including taint vulnerabilities. Using the Open in IDE feature includes an automated connected mode setup to help with the process.
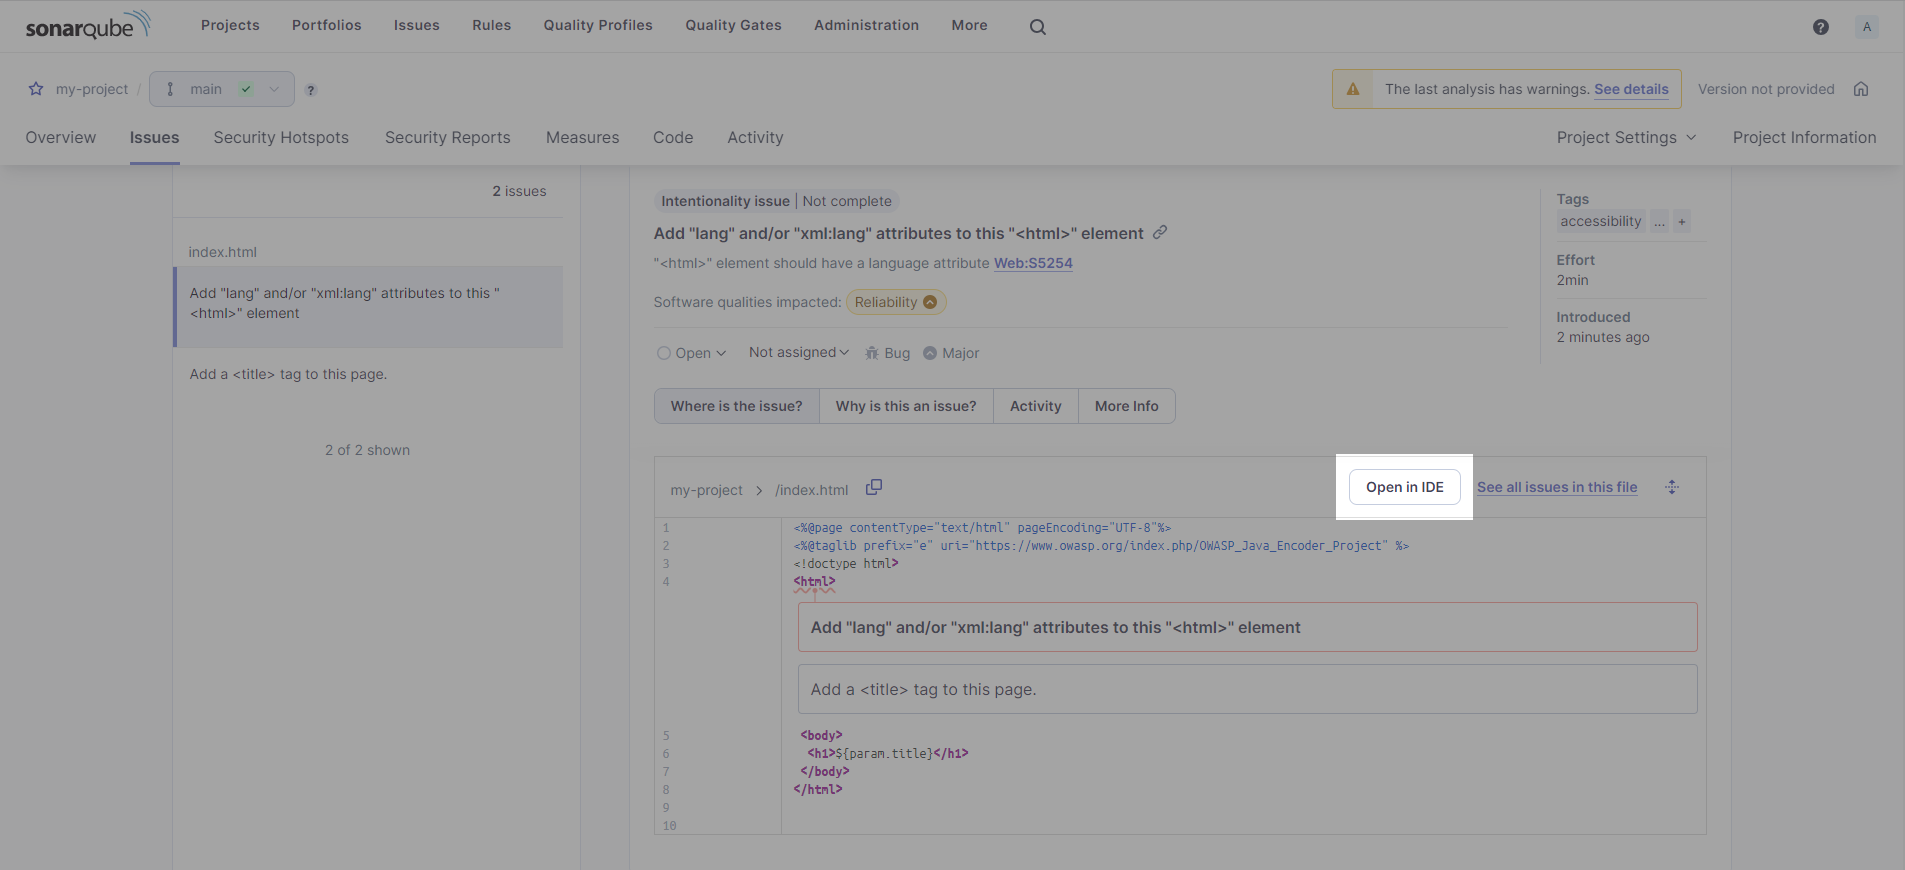
In your instance of SonarQube Server or SonarQube Community Build, or on SonarQube Cloud, navigate to your Project > Issues page, pull up an issue’s detail view and select the Open in IDE button as an authenticated user to edit the issue in your IDE.

It’s best if your project is already open in the appropriate IDE and bound to the server using connected mode; if not, you will be prompted to set up a new connection and/or bind your project using the automatic connected mode setup feature.
If you’ve already fixed the issue in your code, SonarQube for IDE will not be able to find it; only the matching code will be highlighted. In this case, check that recent changes have been analyzed by SonarQube (Server, Cloud) or SonarQube Community Build, then check the documentation on the SonarQube Server, SonarQube Cloud, or SonarQube Community Build Issues page for details about managing your issues on the server.
Please see the Connected mode documentation to bind your project to an instance of SonarQube (Server, Cloud) or SonarQube Community Build. And if you have troubles with the automatic connected mode setup, we identified the most common errors for Troubleshooting connected mode setup.
Viewing AI-generated fix suggestions in the IDE
SonarQube (Server, Cloud) can create AI-generated fix suggestions for issues detected in your code. You can view the suggestions directly in your IDE by selecting View Fix in IDE from the Issues page in SonarQube (Server, Cloud).
The process is similar to selecting the Open in IDE button: it’s best to set up connected mode beforehand. Otherwise, you’ll be prompted to set up a new connection and/or bind your project using the automatic connected mode setup feature.
Focusing on new code
Focusing on new code is an important part of the Clean as You Code approach, where you apply your effort and attention to submit clean code and avoid introducing new issues. SonarQube for VS Code allows you to focus on new code by filtering the issues shown in the IDE, as determined by your new code period.
The Focus on new code feature works when SonarQube for VS Code is running in either connected mode or standalone mode. As mentioned above, new code is defined differently in each mode. Please see the New code page to understand your options when using a New Code Definition.
Setting your focus on new code has these prerequisites running in Connected mode:
- Your local project must be bound to a SonarQube (Server, Cloud) or SonarQube Community Build project.
- The new code definition must be defined in SonarQube (Server, Cloud) or SonarQube Community Build using a Previous version, Number of days, or Specific analysis.
- The Reference branch new code definition is not supported. Please check the documentation in SonarQube Server, SonarQube Cloud, or SonarQube Community Build to properly set your new code definition.
When not running in connected mode, the SonarQube focus feature can still be used to highlight only issues found in new code.
Setting the SonarQube focus on new code is easy. To activate or deactivate this mode, select SonarQube focus: in the VS Code Status Bar, then press Enter or choose Focus on new code or Focus on overall code from the Command Palette. Additionally, you can select or deselect the SonarQube focus mode from the VS Code > Settings… > Settings > Extensions > SonarLint > User settings menu.
By default, the SonarQube focus is set to overall code when you set up a new connection and establish the project binding.
When deciding to override a globally defined new code definition at the project level in SonarQube (Server, Cloud) or SonarQube for Community Build, note that it is not possible to specify a unique new code definition at the branch level and still activate the SonarQube focus: new code mode option.
The SonarQube views
The SonarQube view container in VS Code
RULES
Sonar Rules can individually be turned on or off while running SonarQube for VS Code in standalone mode. Simply go to SONARQUBE > RULES view in the VS Code Activity Bar and deactivate or activate rules at will. Each rule is clearly marked as on or off, and it's possible to filter the visible list by an Active, All, and Inactive status.
When your project is bound to SonarQube (Server, Cloud) or SonarQube Community Build using Connected mode, the rule set is managed on the server side as defined by the quality profile.
CONNECTED MODE
Here you can find your active connections and set up new connections if needed. Please see the Connected mode page to learn about the Sonar solution.
SECURITY HOTSPOTS
If you are in connected mode with SonarQube Server 9.9 or newer, SonarQube Cloud, or SonarQube Community Build, you will see a list of security hotspots here. A list of security-related issues found in the active file will be displayed here; for a full list of issues, select the In Whole Folder feature. The complete details are described on the Security hotspots page.
SONARQUBE ISSUE LOCATIONS
If your issue exists in more than one location, a link will be available in the code actions menu, accessed by right-clicking on the issue or behind the action lightbulb. The action lightbulb is found in both the Code Editor group and PROBLEMS panel as described below.
If your issue is an injection vulnerability, the security issue’s Flow will be shown here. Please see the documentation on Injection vulnerabilities for more information.
Editor Groups
Code Editor
In the VS Code code editor, colored waves (squiggles) underline Warning and Information issues. By default, Hint issues are marked by an ellipsis at the beginning of the line. Hovering over the squiggles will reveal code actions and more information about the issue.
SonarQube Rule Description
The SonarQube Rule Description Editor Group will display a brief explanation of the rule, along with a noncompliant and compliant code example.
Simply right-click an issue in the PROBLEMS Panel, and choose SonarQube: Show issue details for `...` to open the SonarQube Rule Description webview. Here you will find a brief explanation of the rule, along with a noncompliant and compliant code example.
For some SonarQube Rule Descriptions, you can visualize a diff view for the noncompliant and compliant code sample, which should help you fix your issue.

An issue’s Clean Code attribute, software qualities, and severity are presented to you when opening the SonarQube Rule Decription webview. Below the rule title, you will find the Clean Code issue badges that highlight an Issue’s Clean Code classification. Be sure to check out the Investigating issues page for more details about how issues appear in your IDE. Check the Clean Code definition page for details about Clean Code attributes, and the Clean Code benefits page to better understand software qualities for more details about how they help classify your issue.

When in Connected Mode
If you’re running SonarQube for VS Code while in connected mode with SonarQube Server or SonarQube Community Build, your view will change according to the server settings. Standard Experience mode encompasses the use of rule types such as bugs, code smells, and vulnerabilities. Alternatively, if SonarQube Server is set to Multi-Quality Rule mode, you will more accurately represent the impact an issue has on all software qualities.
Please see the SonarQube Server and SonarQube Community Build articles for detailed information about the available rule modes.
Panels
PROBLEMS
Ideally, the team wouldn't introduce any new issues (any new technical debt) when writing code. But in real life, it's not always possible to code without creating new technical debt, and sometimes it's just not worth it.
Selecting issues from the PROBLEMS panel will jump you to the line of code in your file where the code is highlighted. Right-clicking on an issue will reveal fixes that are available for that issue.
Each issue’s severity is indicated by the icon to the left of the description. Selecting an issue or hovering over the severity icon is another way to reveal the Show fixes lightbulb.
OUTPUT
This panel contains the SonarQube for VS Code logs. To view them in more detail and improve troubleshooting, you must enable the Show Verbose Logs and select the Show Analyzer Logs options in the Extensions settings.
Please see the Troubleshooting page for complete details.

To better control the way you see and manage issues, check out the VS Code documentation on Fixing Issues for quick ways to fix problems. Also, look at the article about running SonarQube for VS Code in Connected mode for details about integrating your local analysis with your SonarQube (Server, Cloud) or SonarQube Community Build analysis.
Was this page helpful?