Setting up the monitoring with Datadog
This section explains, in case of a Kubernetes deployment, how to set up the collection by Datadog of the metrics provided through the SonarQube’s Web API (Openmetrics format). In the following, we assume that you are installing both SonarQube and Datadog to a Kubernetes cluster via the corresponding Helm charts.
Introduction
To set up Datadog to monitor SonarQube, you have to specify an annotation in SonarQube’s Helm chart related to Datadog. Since Datadog doesn’t understand the native Prometheus’ Bearer authentication annotation, you cannot use it. Instead, you can specify an annotation that will manage a Datadog configuration file.
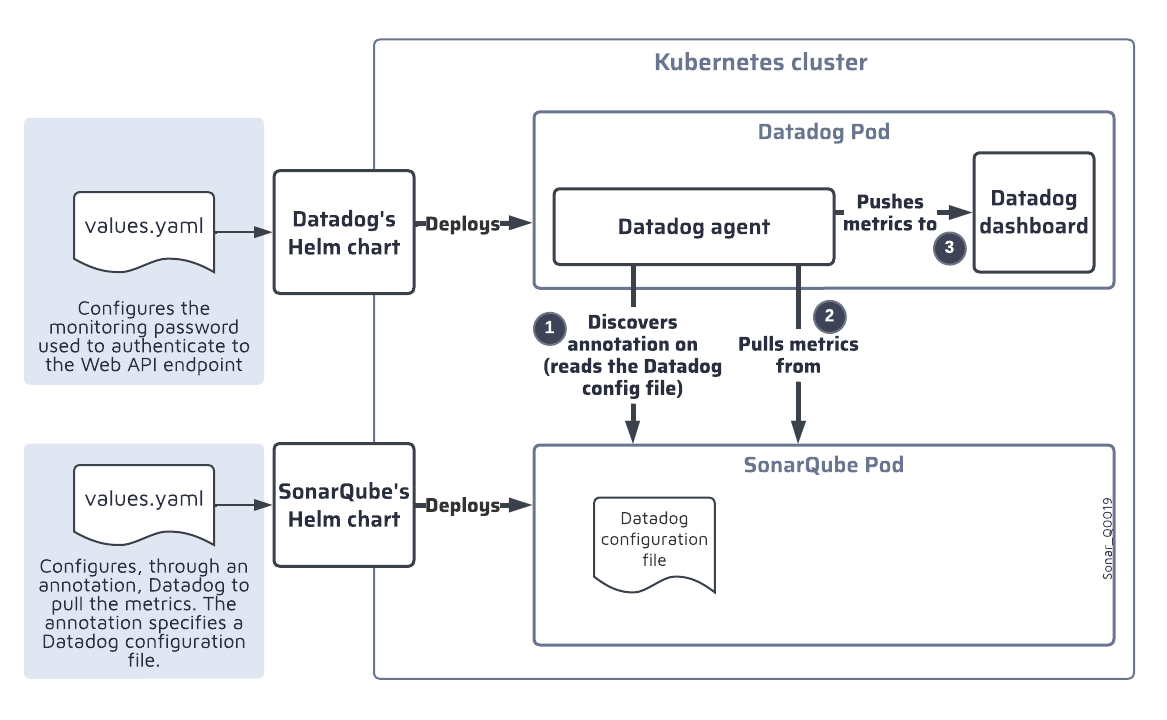
The illustration below shows the setup and monitoring process:
- When you install the SonarQube’s Helm chart in the Kubernetes cluster, the chart deploys the Datadog configuration file on the SonarQube Pod.
- The Datadog agent then:
- Reads the Datadog configuration file.
- Authenticates to the SonarQube’s Web API endpoint and pulls the Prometheus metrics from the endpoint.
- Pushes the metrics to the Datadog dashboard.

Setting up the Datadog authentication to the Web API endpoint
You need to create a secret containing the monitoring passcode and then mount that secret in the Datadog agent. To do so, add the code below to the values.yaml file of the Datadog’s Helm chart. In this example, we mount the subkey passcode from the datadog-api-secret secret into /etc/secret-volume.
agents:
volumes:
- name: secret-volume
secret:
secretName: datadog-api-secret
items:
- key: passcode
path: passcode
volumeMounts:
- name: secret-volume
mountPath: /etc/secret-volumeSpecifying the annotation for the Datadog agent
Add the code below to the values.yaml file of the SonarQube’s Helm chart. Note that:
- This example corresponds to the example shown in Setting up the Datadog authentication to the Web API endpoint above: you must adapt the
readerandwritersections to your values. - If a webcontext is used in the path at which to serve SonarQube then you must add it to the
openmetrics_endpoint. For example, if the/sonarqubeweb context were used here then we would have:
"openmetrics_endpoint": "http://%%host%%:9000/sonarqube/api/monitoring/metrics"
# Set annotations for pods

annotations:

 #ad.datadoghq.com/<EXPECTED_POD_NAME>.checks

 ad.datadoghq.com/sonarqube-dce.checks: |

     {

       "openmetrics": {

         "init_config": {},

         "instances": [

           {

             "openmetrics_endpoint": "http://%%host%%:9000/api/monitoring/metrics",

             "metrics": [".*"],

             "auth_token":

             {

               "reader":

               {

                 "type": "file",

                 "path": "/etc/secret-volume/passcode"

               },

               "writer":

               {

                 "type": "header",

                 "name": "Authorization",

                 "value": "Bearer <TOKEN>"

               }

             }

           }

         ]

       }

     }
Was this page helpful?