10.7 | Server installation and setup | Deploying on Kubernetes | Setting up monitoring | Introduction
SonarQube monitoring on Kubernetes
If you deploy SonarQube on Kubernetes, the following Prometheus metrics can be collected:
- The metrics exposed on the SonarQube Web API’s monitoring endpoint. Results are returned in OpenMetrics text format.
- The JMX metrics exposed by the Prometheus JMX exporter in a format understandable by Prometheus. The exposition of these metrics is disabled by default.
See the List of Prometheus metrics for more information.
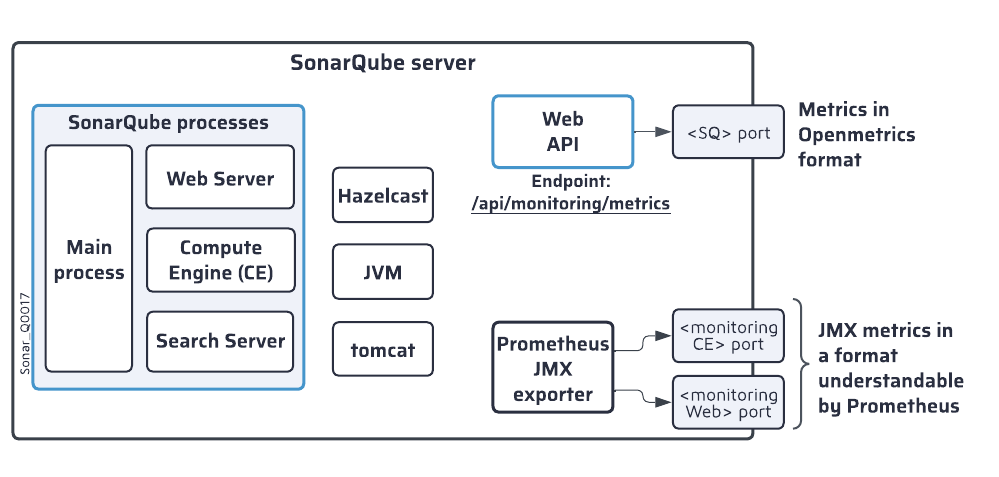
The figure below shows in a simplified way the exposition of the Prometheus metrics. Note that:
- The normal metrics are exposed at the
/api/monitoring/metricsendpoint of the Web API. - The JMX metrics are exposed at two ports, one for the metrics related to the Compute Engine (CE) process and one for the metrics related to the Web server process of SonarQube.

You can collect the metrics in different ways, such as:
- Using SonarQube's native integration with Prometheus.
In that case, you have to connect Prometheus with an observability platform, for example with Grafana.
See Setting up the monitoring with the Prometheus server. - Using Datadog.
In that case, you can use the Datadog observability platform.
See Setting up the monitoring with Datadog.
Was this page helpful?