Troubleshooting the analysis
If your SonarQube Server analysis errors out.
See also the Troubleshooting section on the corresponding Scanner and CI tool page.
To find the scanner logs, see this Community guide.
Viewing the analysis progress status
During analysis, data is requested from the server, the files provided to the analysis are processed, and the resulting data is sent back to the server in the form of a report, which is then analyzed asynchronously on the server side.
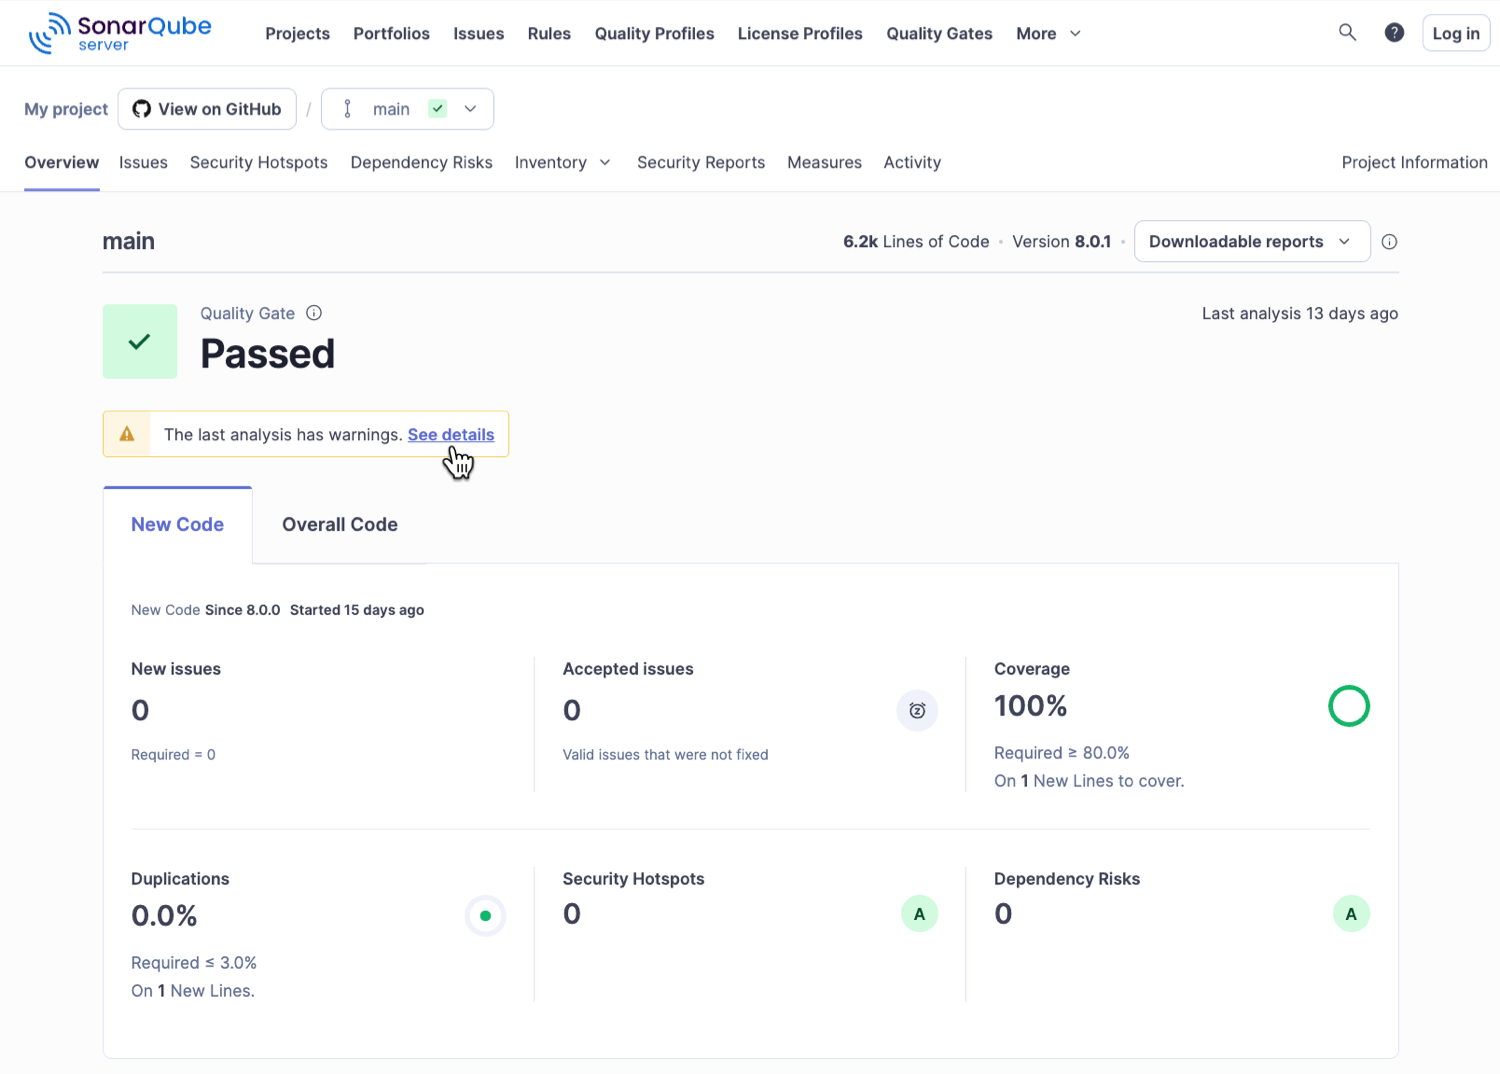
Analysis reports are queued and processed sequentially, so it is quite possible that for a brief period after your analysis log shows completion, the updated values are not visible in your SonarQube Server project. However, you will be able to tell what’s going on because an icon will be added on the project overview page, to the right of the project name. Mouse over it for more information. The icon goes away once the analysis processing is complete. However, if there are issues with the analysis, a warning message appears. Click on the see details link to reveal a list of analysis issues.

Out of memory error
If your analysis errors out with java.lang.OutOfMemoryError: GC overhead limit exceeded then it means that your project is too large or too intricate for the scanner to analyze with the default memory allocation. To fix this you’ll want to allocate a larger heap (using -Xmx[numeric value here]) to the process running the analysis. Some CI engines may give you an input to specify the necessary values, for instance if you’re using a Maven Build Step in a Jenkins job to run analysis. Otherwise, use Java Options to set a higher value. Note that details of setting Java Options are omitted here because they vary depending on the environment.
You can also add an exclusion to manage the files and folders you don’t need to analyze by limiting your analysis scope. Additionally, using a Solid-state drive or something similar will help speed up the analysis process and thus use less memory, especially for small file access.
PKIX path building failed
If your analysis errors out with PKIX path building failed then it means that your SonarQube Server is configured with HTTPS and a self-signed SSL certificate (see Securing behind a proxy). However, the certificate is not correctly configured in the scanner machine’s JVM. This configuration is outside of SonarQube Server scope. The server certificate is unknown and could not be validated with the provided truststore. To solve the issue, you need to import the SonarQube Server certificate to the Java truststore (see TLS certificates on client side). See also Oracle’s documentation for more information.
No response from server
If, for example, after a PostgreSQL database upgrade, the CPU usage has increased drastically in SonarQube Server and your build process is blocked at the code scanning step (no response from SonarQube Server), try reindexing the following database tables: issues, rules, and components.
Various error messages
The format of the analysis property sonar.token= is invalid
You may encounter this issue when using SONAR_TOKEN as a secret in a calling workflow in GitHub Actions in case the called workflow doesn’t manage to read it as a secret. In that case, make sure that the secret is inherited from the calling workflow (you may use the secrets: inherit keyword). See GitHub documentation for more information.
The maximum number of open files was reached
On a Linux system, see Configuring the maximum number of open files and other limits in On Linux systems.
On a MacOS system, see Configuring the maximum number of open files in On macOS systems.
Error when analyzing files with non-ASCII characters in the name
When analyzing files with non-ASCII characters in the name, if the Malformed input or input contains unmappable characters error is raised then you should make sure that the environment variables LC_ALL and LANG are properly set before running the analysis as shown below.
No coverage data in pull request analysis report with AWS CodeBuild
Verify that AWS CodeBuild LOCAL_SOURCE_CACHE feature is disabled.
Failed to upload analysis report on cloud platform
If you encounter the "SonarQubeAnalyze fails at upload report - error POST 403 - Failed to upload: You’re not authorized" error and you’re running SonarQube Server on a cloud platform, check that the cloud environment’s firewall (WAF) configuration allows the upload. WAF rules can potentially block SonarQube Server APIs, including the report submission.
Self-signed certificate error
See TLS certificates on client side.
Analysis stops with an error on Windows
If your username on Windows ends with a special character, for example C:\Users\myUser!\, the analysis will fail. Either change the username or, if that’s not possible, use the sonar.userHome parameter and set a path that doesn’t include any special characters. See Analysis parameters for more information about sonar.userHome.
Missing blame information or Could not find ref error
The errors "Missing blame information…" and "Could not find ref…" can be caused by checking out with a partial or shallow clone, or when using Git submodules. You should disable git shallow clone to make sure the scanner has access to all of your history when running analysis. See Checked-out code.
Debugging the analysis
For debugging purposes, you can use the sonar.scanner.internal.dumpToFile parameter to output to a specific file a full list of properties retrieved by the scanners (CLI, Gradle, Maven, and NPM). The properties include user properties passed through command line arguments, configuration files, environmental variables, and other properties relevant to the specific scanners.
Possible value: path to the output file name.
Deprecated: sonar.scanner.dumpToFile
Note: The equivalent output is available in Your Project > Project Settings > Background Tasks > 3-dots menu > Show SonarScanner Context. If the analysis report fails, the list is not generated in Show SonarScanner Context.
Last updated
Was this helpful?

