Viewing your first analysis' results
If you have successfully followed the in-product tutorial, SonarQube Cloud will run its first analysis on your project.
The first analysis is always a main branch analysis (an analysis of the default branch of your repository, usually called main or master).
From now on, a new analysis will be triggered every time you make a change to the main branch by direct push, pull request merge, or branch merge.

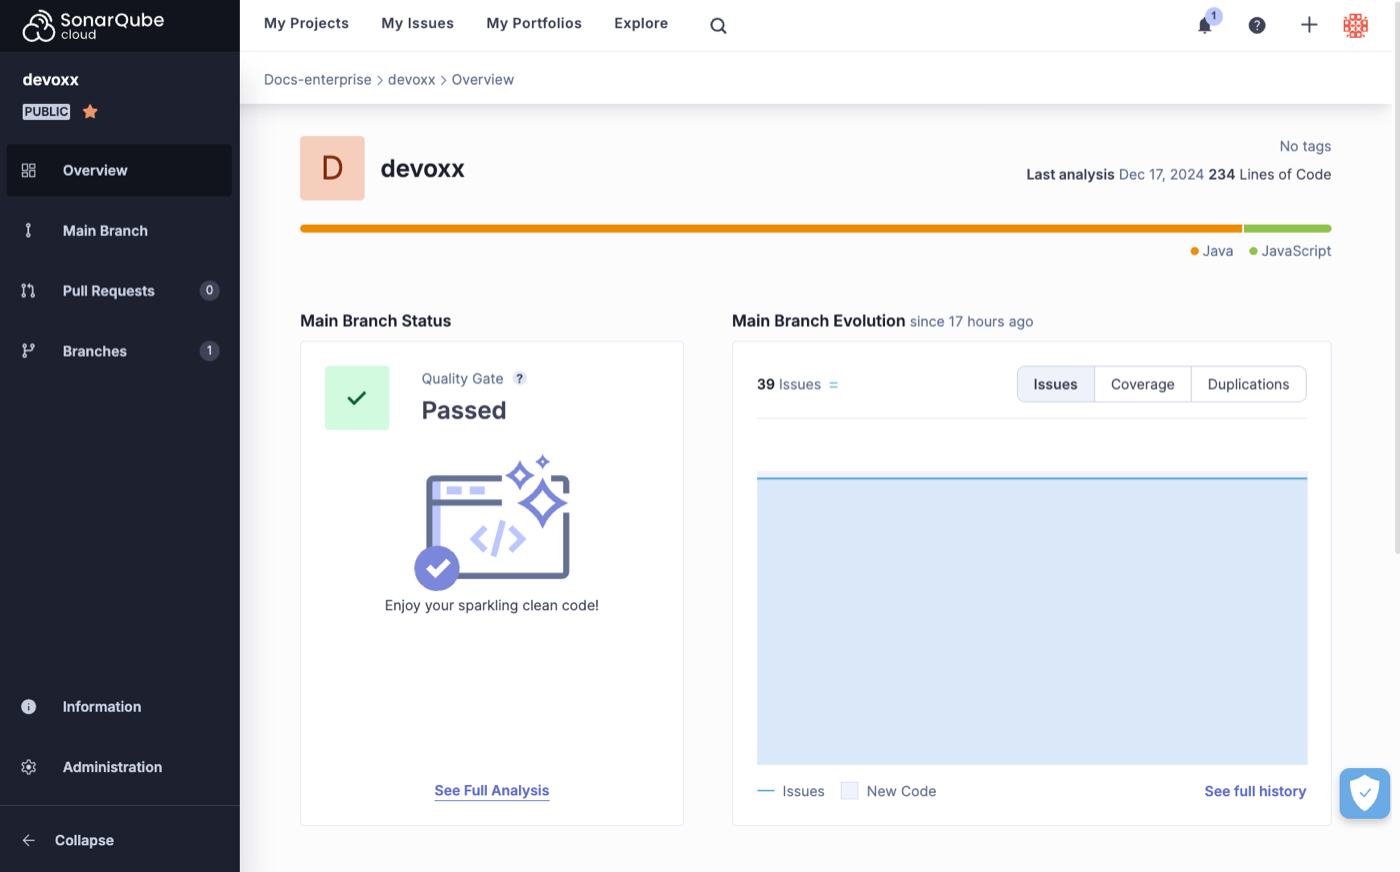
Main Branch Status
The Main Branch Status is the quality gate of your main branch, indicating whether it meets your quality requirements and is ready to be released.
The quality gate displays Not Computed because it needs to be configured.
We strongly recommend that you set up your main branch quality gate. To do so, you must set a new code definition. Select Set New Code Definition to get started.
See the Quality gate and About new code pagesfor more details. Once you set it up, push a change to the main branch. A new analysis will run, and the quality gate status will display either Passed or Failed.
Main Branch Evolution
The Main Branch Evolution displays a summary of the code quality results from the main branch analysis. In this section, you will find tabs that display different metrics:
- Issues displays the number of issues found in the main branch.
- Coverage displays the percentage of testable code in the main branch that is covered by your test cases.
- Duplications displays the percentage of main branch code that is duplicated.
Coverage displays zero percent because it needs to be configured.
Initially, your coverage will display zero percent because it requires configuration. To set it up, see the Coverage section.
Once it's configured, push a change to the main branch to update the analysis. After the a new analysis is run, the coverage percentage will be displayed.
The historical data chart shows the progress of your code quality.
To see historical data, you must have run at least two analyses.
Push a change to your main branch. A new analysis will run, and the historical data will be displayed. In the Main Branch Evolution section, select See full history to the project's Activity page.
Latest Activity
Scroll down to find the Latest Activity section; it displays a feed of all analyses that have been run, including all main branch analyses, pull request analyses, and branch analyses.
Project navigation
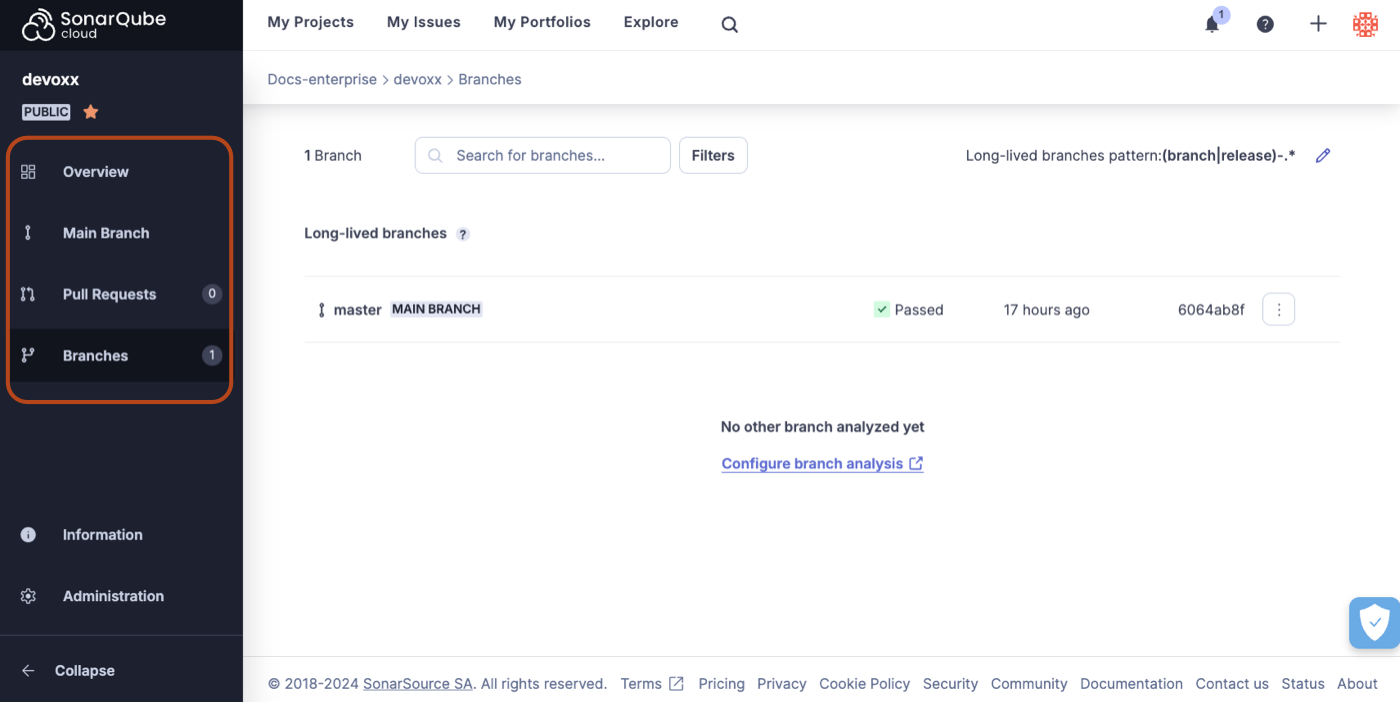
The project navigation on the left lets you move between the four views: Overview, Main Branch, Pull Requests, and Branches.

Main Branch
Select Branches > MAIN BRANCH to see a more fine-grained view of your most recent Main branch analysis.
Pull Requests
In addition to analyzing your main branch every time it changes, SonarQube Cloud also analyzes individual pull requests. These analyses run when a pull request is opened and on each change to the pull request branch. This all happens before you merge, letting you catch problems before they even get to the main branch, an important part of the Clean as You Code methodology. The results of pull request analysis are displayed in the Pull Requests view of your SonarQube Cloud project and the pull request view of your DevOps Platform (GitHub, Bitbucket Cloud, Azure DevOps, or GitLab).
See the Pull request analysis page for more details.
Branches
The Branches view displays all the non-pull request branches for which you have set up analysis. Initially, only the main branch is listed here. But, you can configure other branches to be analyzed. Once a branch is configured, an analysis is run on every change to that branch.
See Branch analysis and Branch analysis setup.
Was this page helpful?