Running an analysis
On this page
Now that you've installed the SonarQube for IDE extension in your IDE, running an analysis is straight-forward. For the most part, new analyses are automatically triggered when you open a file, as you type, or with each file save following a change in the code. Below we've outlined other ways to trigger a SonarQube for IDE analysis.
Triggering an analysis
First, open a project containing C#, VB, C++, JavaScript, or TypeScript files.
For C# and VB.Net, new issues are reported as you type. The rules are run automatically, clicking Analyze > Run Code Analysis is not required.
For the other languages, new issues are reported when you open or save a file.
Check the Investigating issues page for details about how to recognize issues in your IDE.
Analysis results
The status bar indicates that an analysis is running and will update when (the analysis is) finished:

Issues are highlighted in your code and also listed in the Error List. Sonar Rule descriptions appear when you hover over code that triggered an issue:

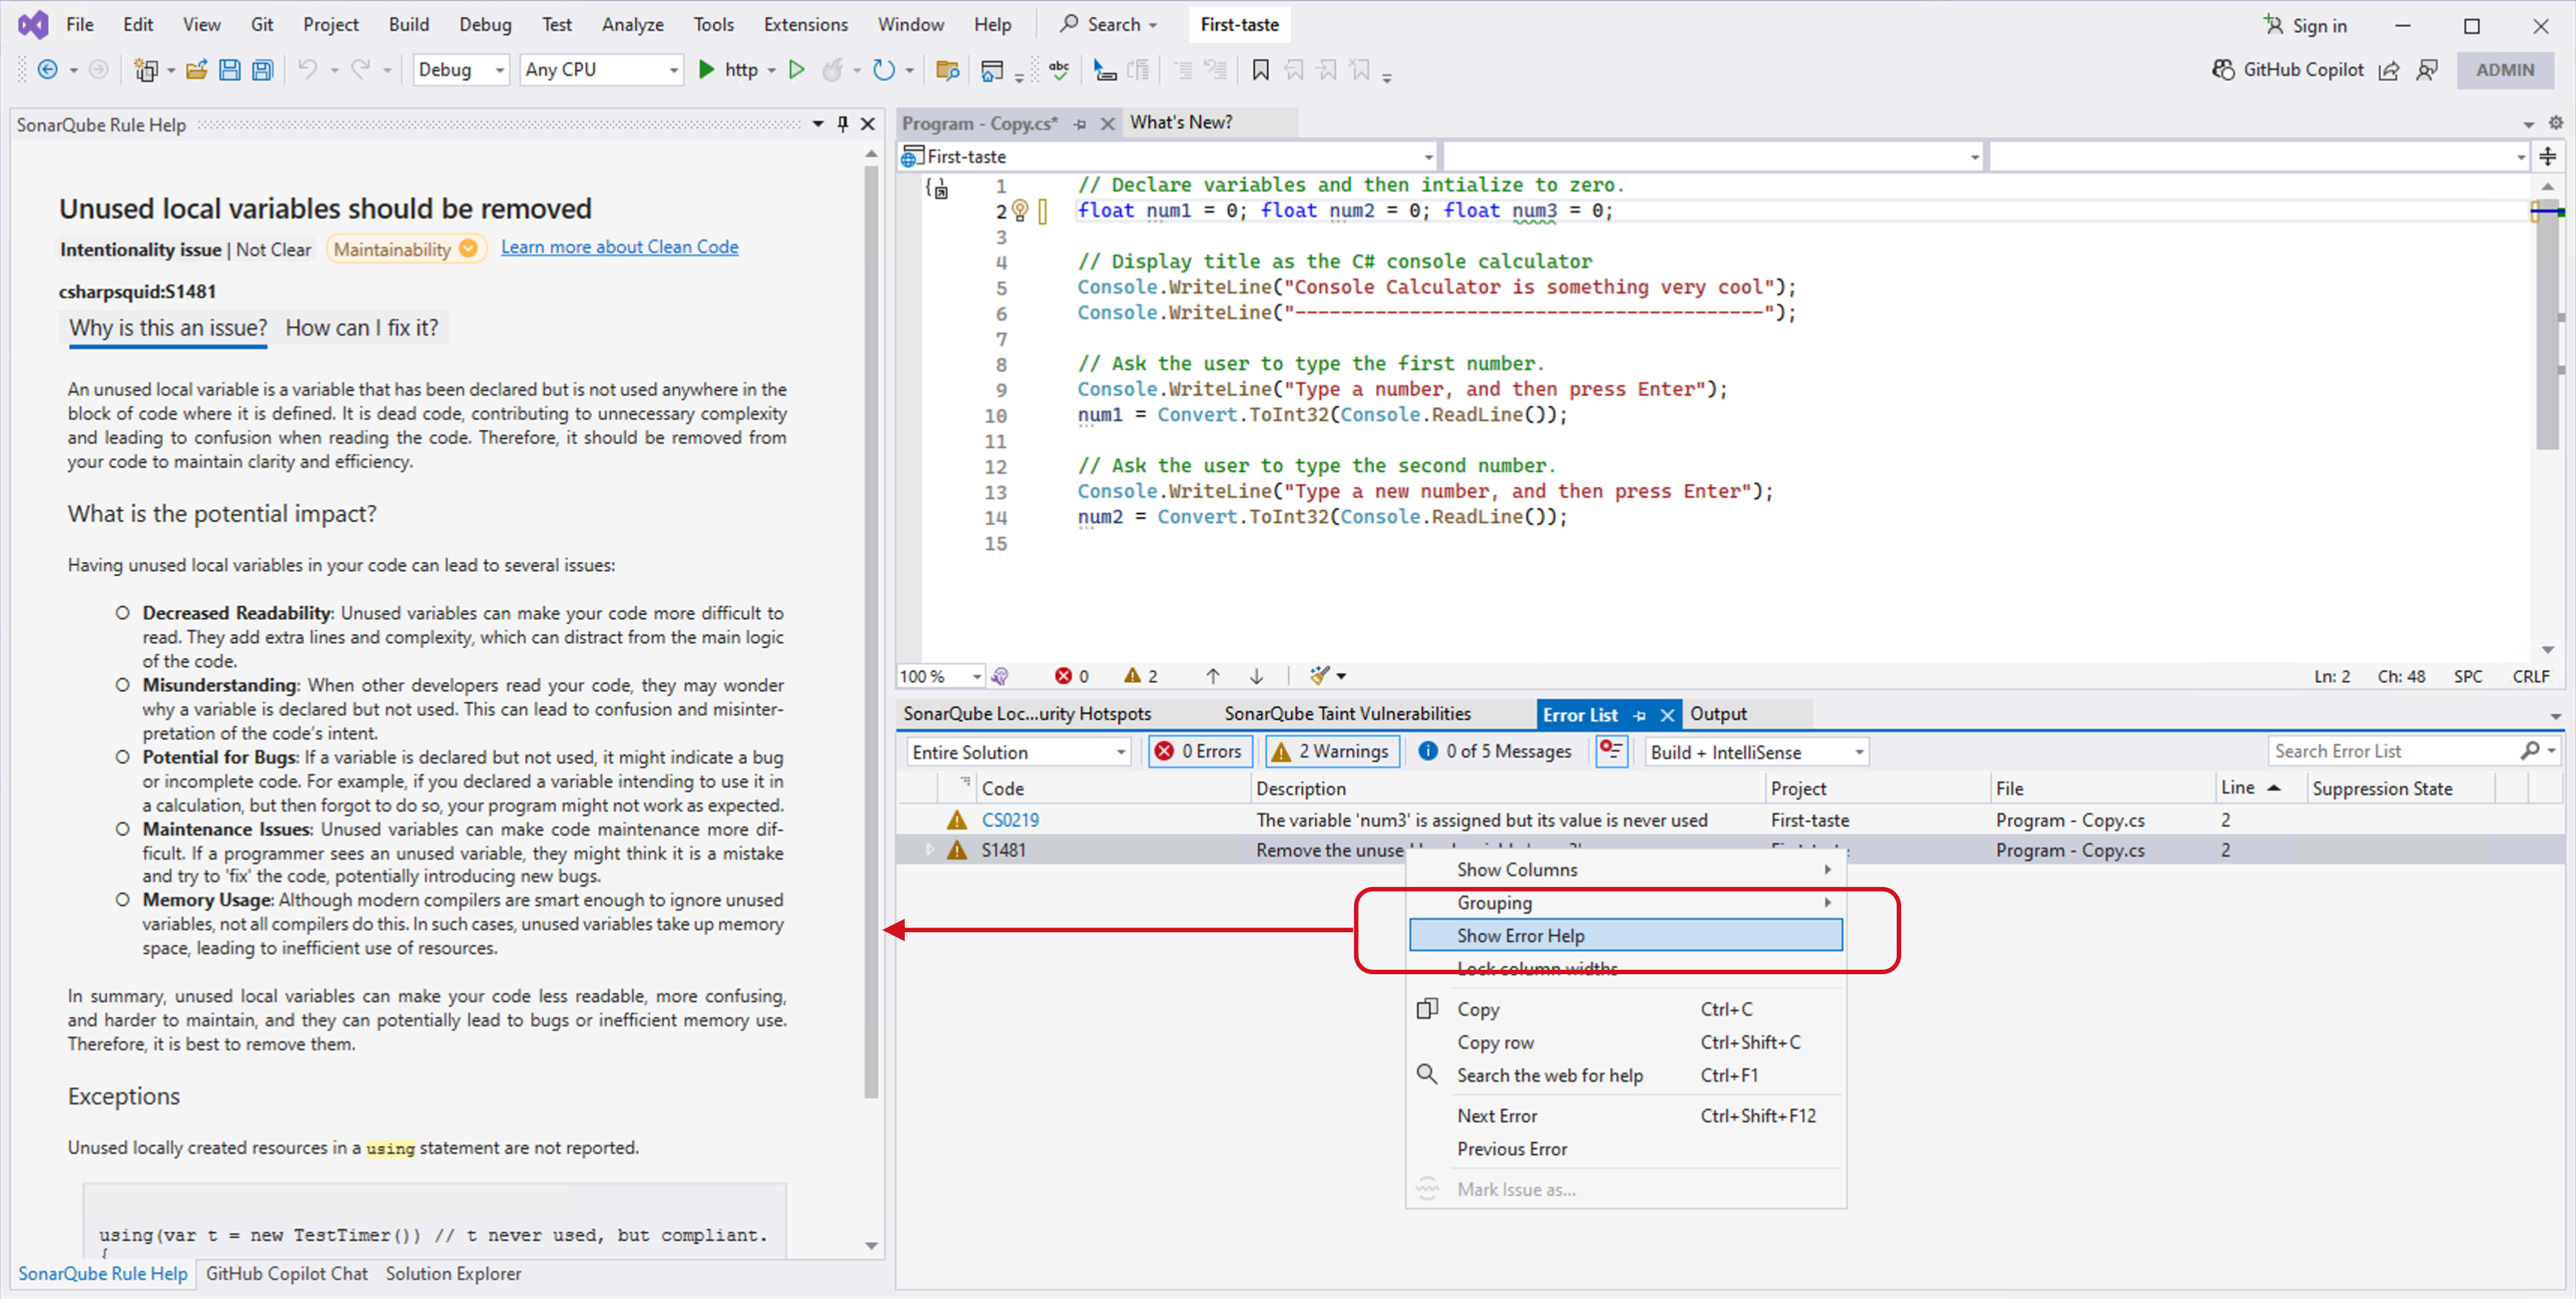
To get a detailed description, click the error code or right-click the error in the Error List and select Show Error Help.

For details on managing rules, see the page on Rules and Languages. It will also include details about parameterizing Roslyn analyzers.
Was this page helpful?