Monitoring the code metrics of your portfolio
Portfolios are available starting in Enterprise Edition.
To view the values of all code metrics in your portfolio:
- In the top navigation bar, click Portfolios and then click the portfolio you want to monitor.
- In the portfolio navigation bar, click Measures.
To view the value history of one or several code metrics in your portfolio:
1. In the top navigation bar, click Portfolios and then click the portfolio you want to monitor.
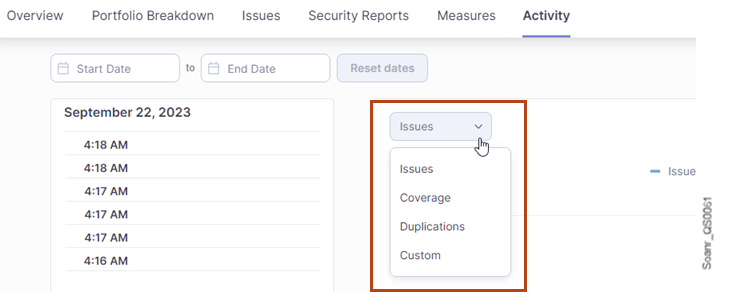
2. In the portfolio navigation bar, click Activity. The number of issues is shown in a graph.
3. To change the metrics shown, click Issues and select another metric category in the drop-down list.

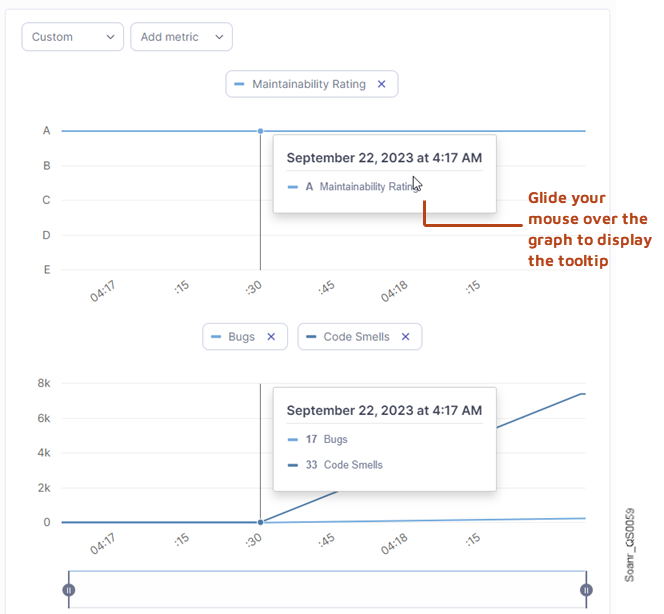
4. Select Custom if you want to monitor other metrics: the Add metric drop-down list is displayed. Then, click Add metric and select in the drop-down list the metric(s) you want to monitor. A graph is displayed for each selected metric so that you can compare them.

Was this page helpful?