Monitoring the code metrics of your project
You can view the values of all code metrics in your project and you can view the value history of one or several code metrics in your project.
Viewing the values of all code metrics
- In the top navigation bar, click Projects and then click the project you want to monitor.
- In the project navigation bar, click Measures.
Viewing the value history of one or several metrics
1. In the top navigation bar, click Projects and then click the project you want to monitor.
2. In the project navigation bar, select Activity. The left sidebar contains the list of code scans performed on your project.
3. In Filter events, you can filter the scans list by event type (see Event types in Viewing the project activity and history).
4. Issues are shown in the graph by default. To change the metrics shown, click Issues and select another metric category in the drop-down list.

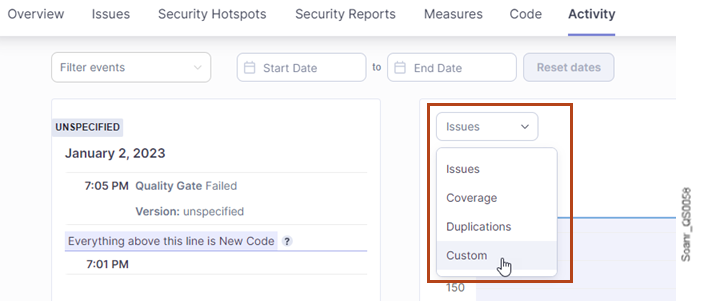
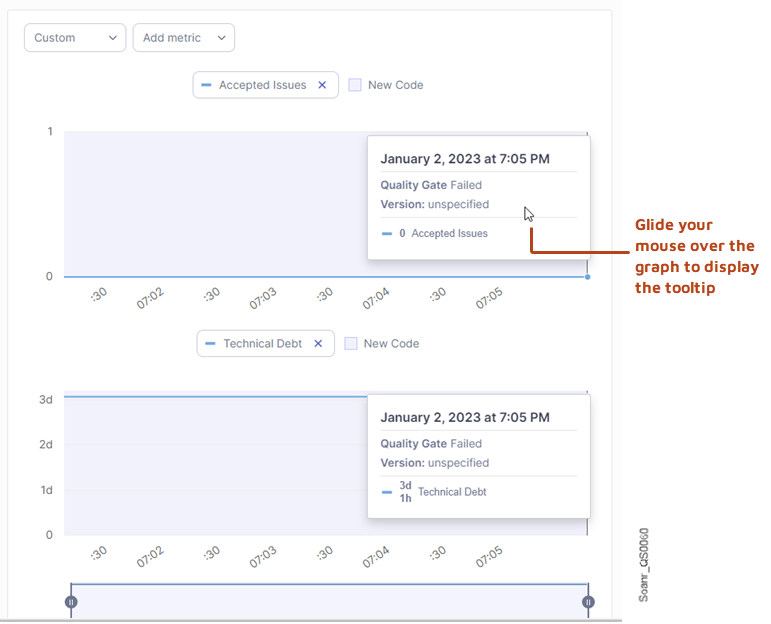
5. Select Custom if you want to monitor other metrics: the Add metric drop-down list is displayed. Then, click Add metric and select in the drop-down list the metric(s) you want to monitor. The selected metrics are displayed in one or several graphs so that you can compare them.

Was this page helpful?
© 2008-2025 SonarSource SA. All rights reserved. SONAR, SONARSOURCE, SONARQUBE, and CLEAN AS YOU CODE are trademarks of SonarSource SA.