Reviewing issues
Navigate and review issues raised by SonarQube's automated code review and analysis.
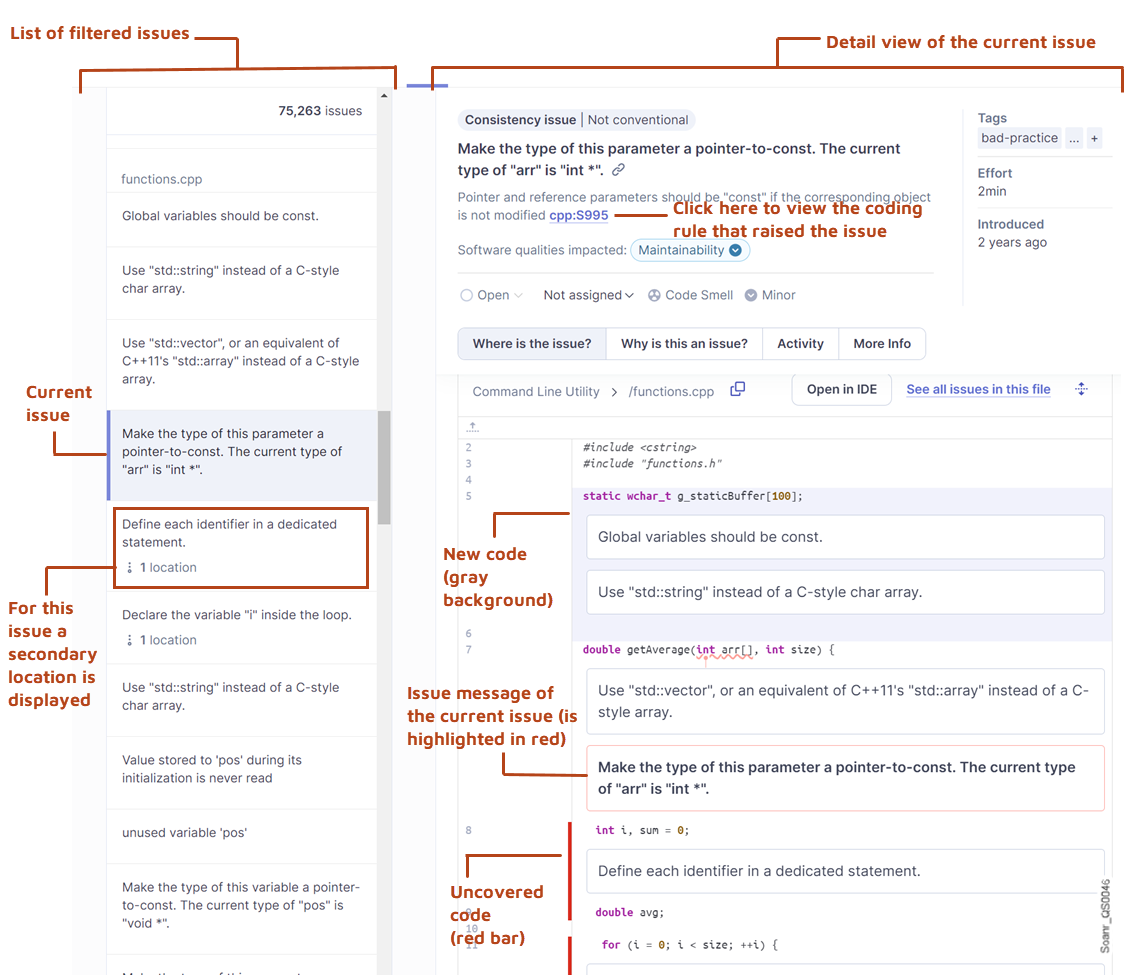
SonarQube highlights the specific lines of code associated with identified issues.
To view an issue in the code:
1. Retrieve the issue and open its detail view. See Retrieving issues for more information.
2. In the Where is the issue? tab, you can see the issue’s location with the issue message.

3. Depending on the issue, secondary locations or execution flows may be displayed to help you understand it or trace its source. To navigate through the secondary locations or the issue flow, see below.
4. To understand why this is an issue, open the Why is this an issue? tab in the issue description. You can also open the rule that raised the issue by selecting the rule link at the top of the issue description.
Navigating through the issue’s secondary locations
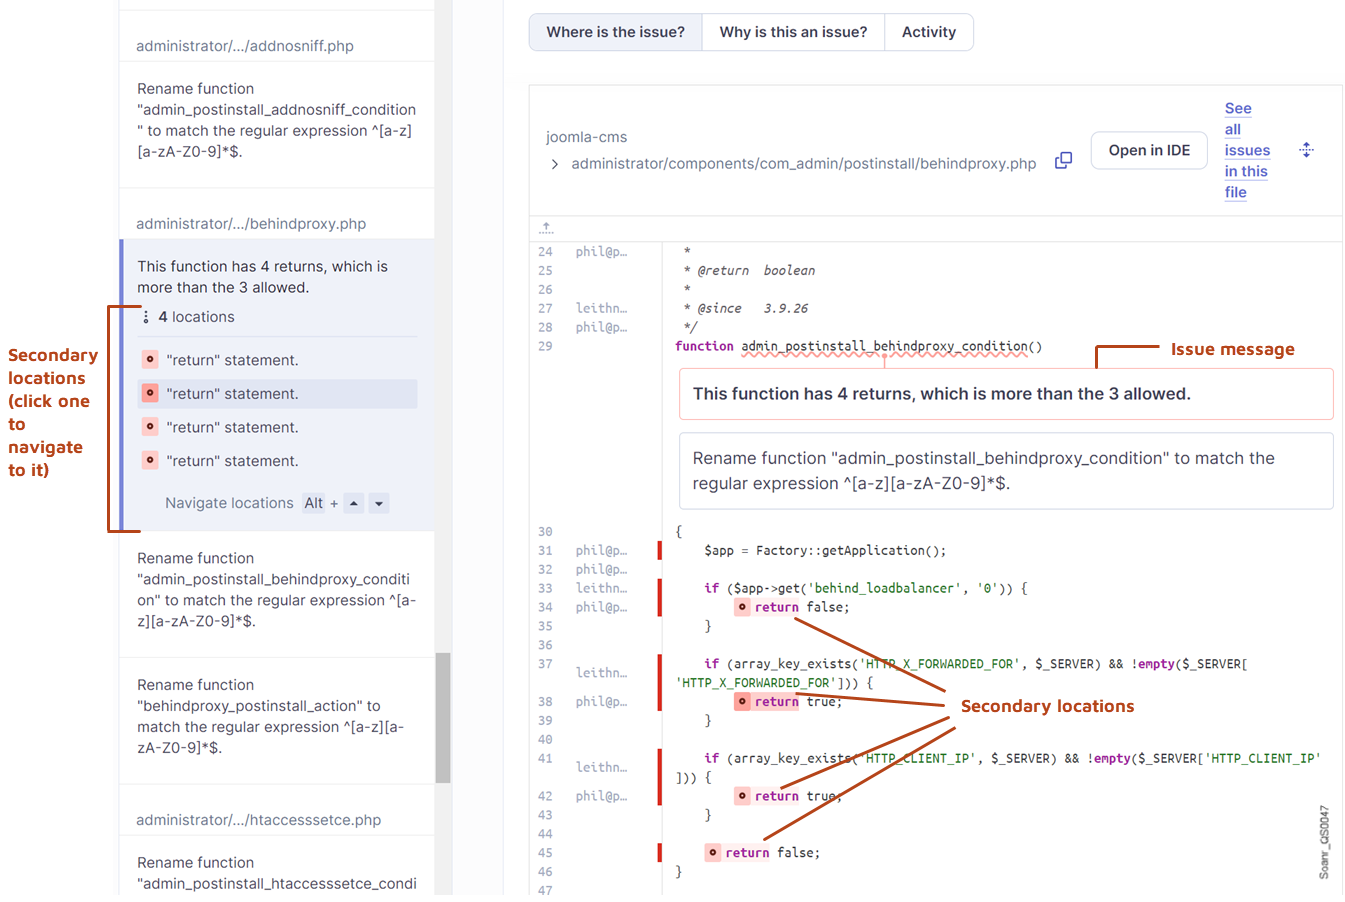
All SonarQube Server issues specify a location in the code showing where the issue occurs. However, some of the more complex rules produce issues for which a single location is not enough to adequately explain why the issue has occurred. These more complex rules often identify additional locations in the code to help understand the problem. These additional locations are referred to as secondary locations. Secondary locations may just indicate other locations that are related to the issue or may identify a flow through the code that leads to the issue.
Other locations
To navigate through the other locations of an issue:
1. Retrieve the issue and open its detail view. In the left sidebar, the secondary locations are listed as illustrated below. See Retrieving issues for more information.

2. To navigate to a secondary location, click on it in the list. You can also use the keyboard combination indicated under the list to navigate to the previous or next location.
Execution flow
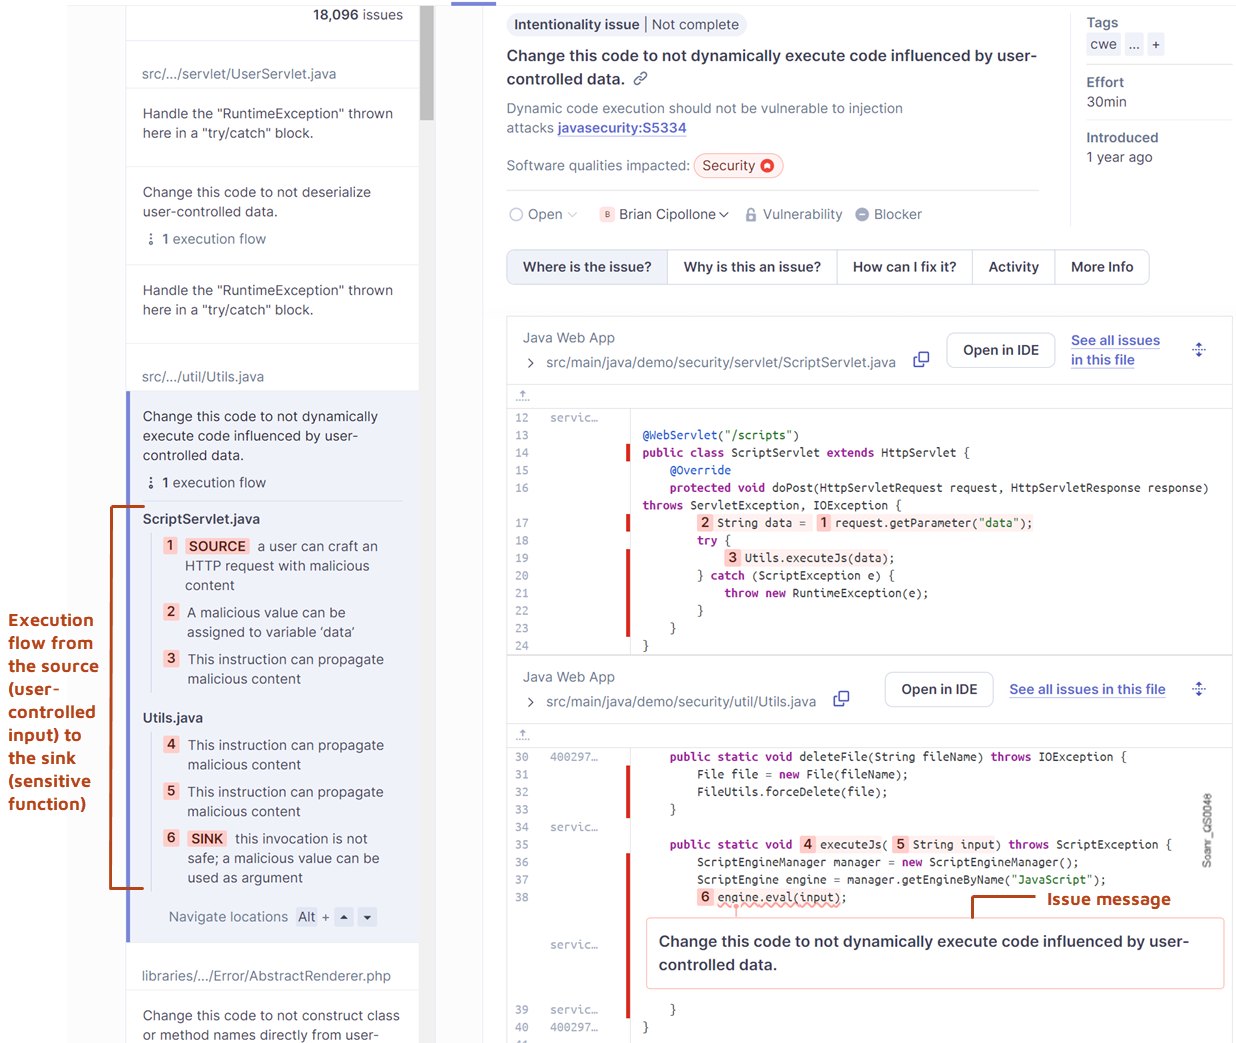
When the issue originates upstream, paths through the code (execution flows) are shown from the source to the sink (destination). In particular, for issues breaking a security-injection rule, there is a vulnerability when the inputs handled by your application are controlled by a user (potentially an attacker) and not validated or sanitized. In that case, SonarQube Server displays the execution flow from the sources (user-controlled inputs) to sinks (sensitive functions).
Check out this video for an example of a security issue with an execution flow.
To navigate through the execution flow(s) of an issue:
1. Retrieve the issue and open its detail view as described above. In the left sidebar, the execution flows are listed as illustrated below. In the example below, the source is located in another file than the sink.

2. To navigate to a location in the execution flow, select it in the list. You can also use the key combination indicated under the flow to navigate to the previous or next location in the flow.
Viewing the issue management history and comments
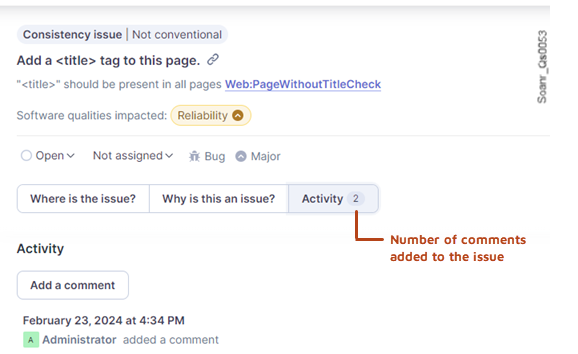
Retrieve the issue and open its detail view as described above in Retrieving issues.
Open the Activity tab.

Last updated
Was this helpful?

