# Investigating issues
SonarQube for IDE can help developers by letting them perform local analyses to check their code before pushing it back to the SCM. While running an analysis, SonarQube for IDE raises an issue every time a piece of code breaks a coding rule.
Usually, a first analysis is performed as soon as one of the supported files is opened. Then, regular analyses are triggered when the editor content changes and/or when the file is saved.
This page describes how to find and investigate issues in your IDE.
## Defining issues
An *issue* is a problem in your code that violates one of the Sonar rules. Issues found in code are linked to coding attributes and software qualities that determine the overall severity of an issue. Software qualities determine the overall severity of an issue that feeds back into the overall status of your code; please see pages on quality standards in the SonarQube Server and SonarQube Cloud documentation for more information:
* [Quality standards and new code](https://app.gitbook.com/s/LWhbesChsC4Yd1BbhHhS/user-guide/about-new-code "mention") in SonarQube Server
* [Quality standards and new code](https://app.gitbook.com/s/B4UT2GNiZKjtxFtcFAL7/standards/about-new-code "mention") in SonarQube Cloud
Each issue is linked to one coding attribute which is associated with one or more software qualities; each software quality has a level of severity. See the [software-qualities](https://docs.sonarsource.com/sonarqube-for-visual-studio/using/software-qualities "mention") page for details.
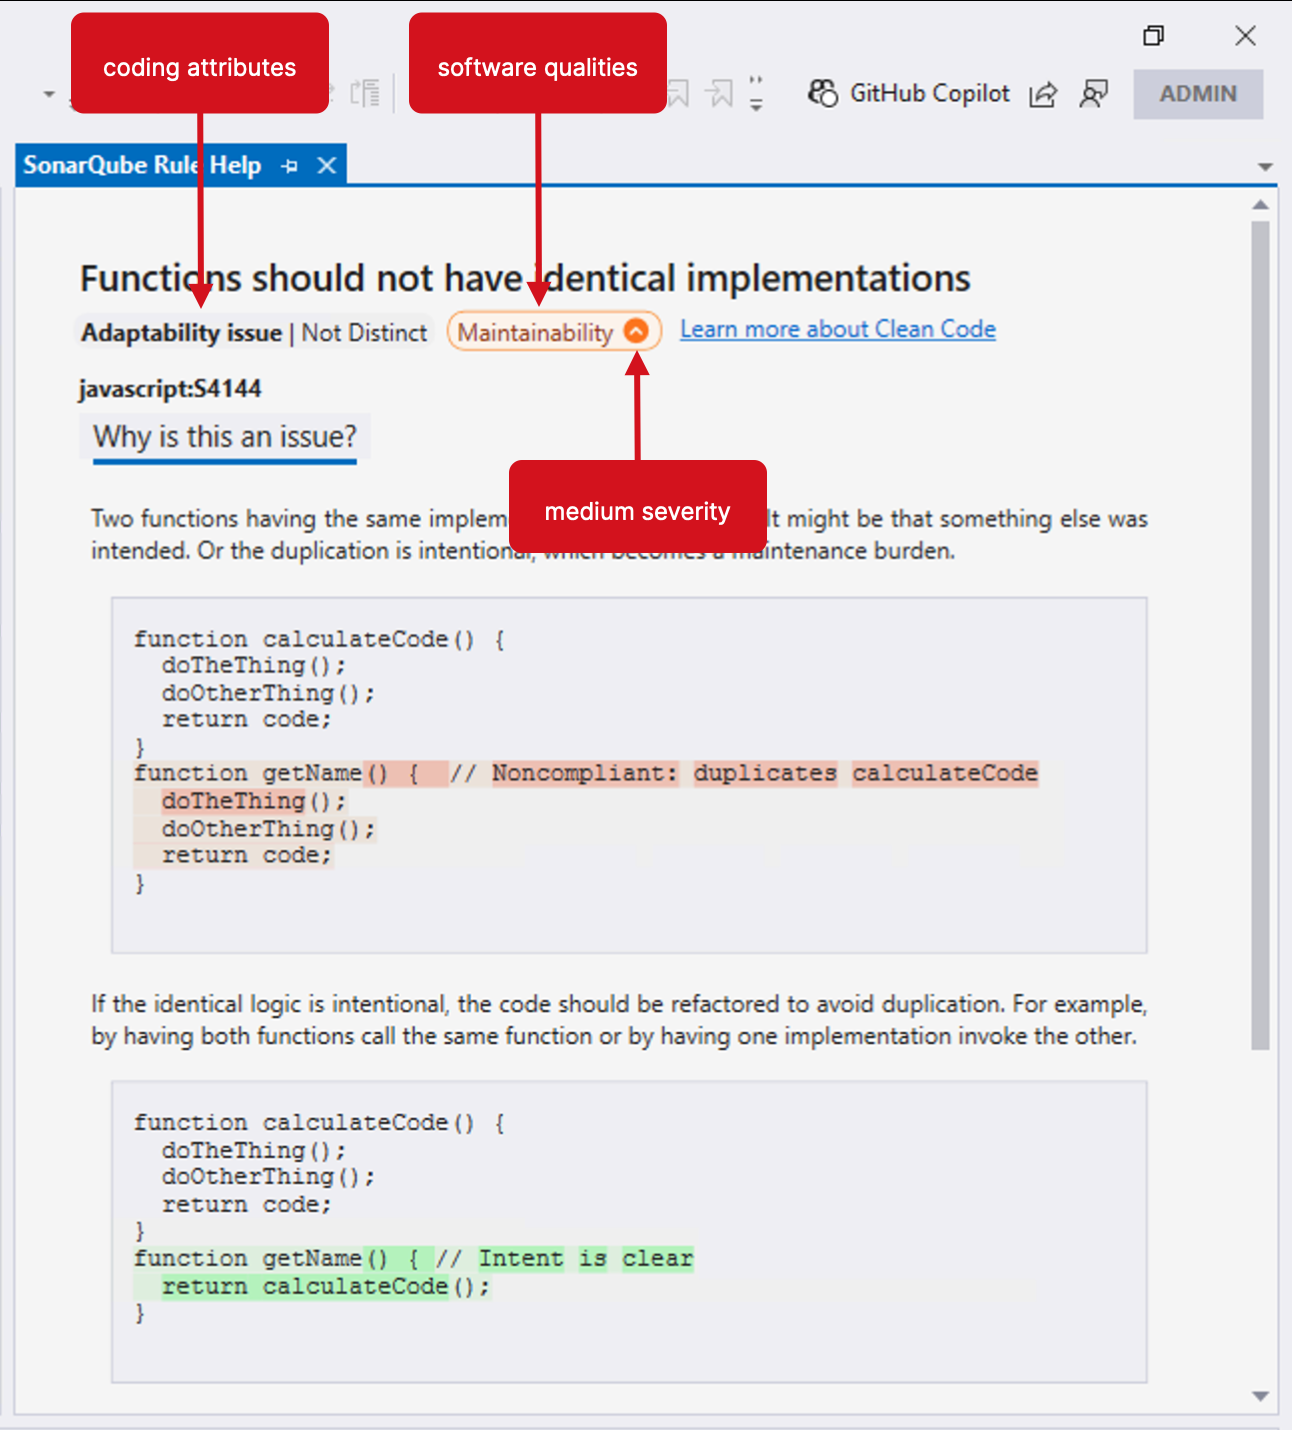
To communicate the code attributes, software qualities, and severity of issues found in your code, SonarQube for Visual Studio displays them in the **SonarQube Rule Help** view as described below.
## Finding issues
For most issues, SonarQube for Visual Studio provides information about *why* there is an issue and offers one or more actions to fix your issue. Information about [fixing-issues](https://docs.sonarsource.com/sonarqube-for-visual-studio/using/fixing-issues "mention") is displayed in 3 places:
1. In the **Visual Studio Text Editor**, identifiable by the classic squiggles underlining issues in the code.
2. In the **SonarQube Report** tool window. See the [#sonarqube-issue-visualization](#sonarqube-issue-visualization "mention") article below for details.
* Security hotspots and injection vulnerabilities are also found in the **SonarQube Report** tool window. Check the [security-hotspots](https://docs.sonarsource.com/sonarqube-for-visual-studio/using/security-hotspots "mention") and [taint-vulnerabilities](https://docs.sonarsource.com/sonarqube-for-visual-studio/using/taint-vulnerabilities "mention") pages for more details.
3. In the built-in Visual Studio **Errors List** tool window.
{% hint style="info" %}
When you see a C# issue that has been suppressed, its origin can be either:
* A server-side status (Accepted / False Positive) synchronized from SonarQube in connected mode.
* Or an in‑code pragma such as \`#pragma warning disable S1234\` targeting a Sonar rule ID.
For details on how to use and clean up these in‑code suppressions, see the article about [#suppressing-issues](https://docs.sonarsource.com/sonarqube-for-visual-studio/fixing-issues#suppressing-issues "mention").
{% endhint %}
### Opening issues in the IDE
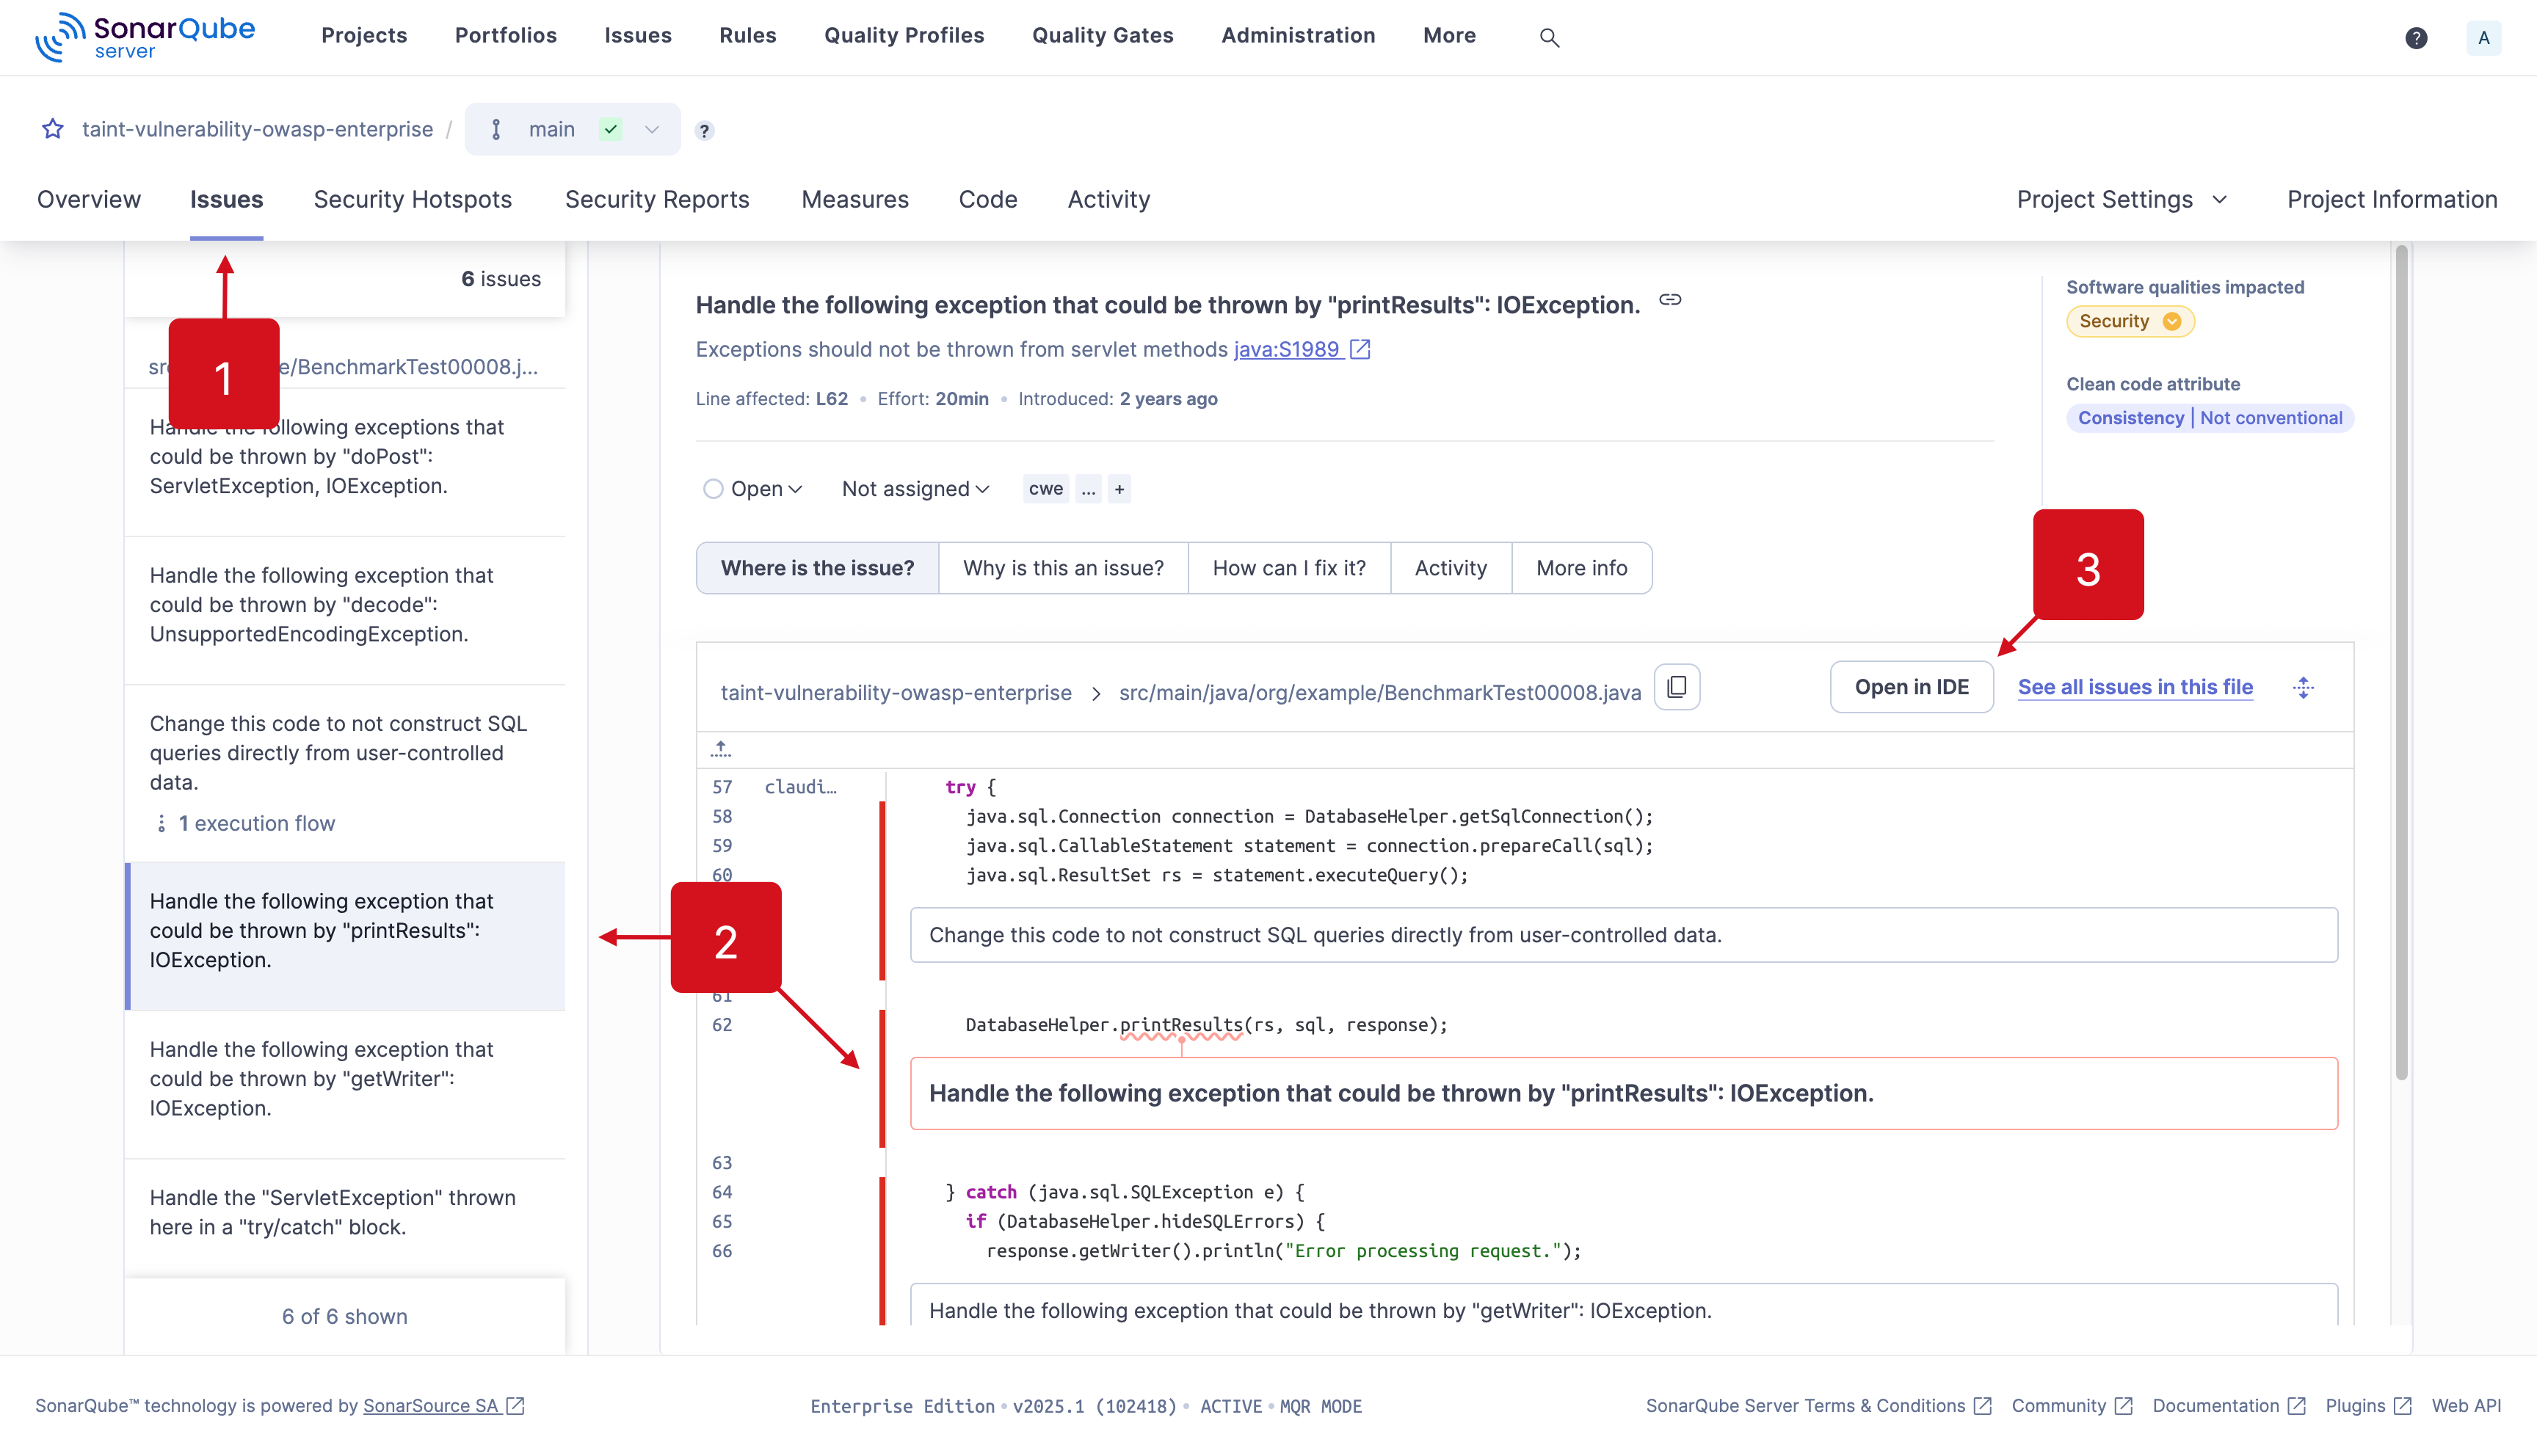
Understanding issues in context is a helpful way to address problems more effectively. Beginning in SonarQube Server 10.3, on SonarQube Cloud, and in SonarQube Community Build, it is possible to open all issues in your IDE, including taint vulnerabilities. Using the **Open in IDE** feature includes an automated connected mode setup to help with the process.
In your instance of SonarQube Server or SonarQube Community Build, or on SonarQube Cloud:
1. Navigate to your **Project** > **Issues** page,
2. select an issue’s detail view,
3. and select the **Open in IDE** button as an authenticated user to edit the issue in your IDE.
{% hint style="warning" %}
**Open in IDE** is not supported in Safari. Safari has strict security policies regarding custom protocol links which are required to open files directly in your IDE. When using SonraQube (Server, Cloud) or SonarQube Community Build, please use Chrome or Firefox for this functionality.
{% endhint %}
It’s best if your project is already open in the appropriate IDE and bound to the server using connected mode; if not, you will be prompted to set up a new connection and/or bind your project using the automatic connected mode setup feature.
If you’ve already fixed the issue in your code, SonarQube for IDE will not be able to find it; only the matching code will be highlighted. In this case, check that recent changes have been analyzed by SonarQube (Server, Cloud) or SonarQube Community Build, then check the documentation on the relevant Issues pages for details about managing your issues on the server:
* [Managing issues](https://app.gitbook.com/s/LWhbesChsC4Yd1BbhHhS/user-guide/issues "mention") in SonarQube Server.
* [Managing code issues](https://app.gitbook.com/s/B4UT2GNiZKjtxFtcFAL7/managing-your-projects/issues "mention") in SonarQube Cloud.
* [Managing issues](https://app.gitbook.com/s/bqrfLGeD0Y9vE5l9Le42/user-guide/issues "mention") in SonarQube Community Build.
Please see the [connected-mode](https://docs.sonarsource.com/sonarqube-for-visual-studio/connect-your-ide/connected-mode "mention") documentation to [#configure-your-binding](https://docs.sonarsource.com/sonarqube-for-visual-studio/connect-your-ide/setup#configure-your-binding "mention") with a project in SonarQube (Server, Cloud) or SonarQube Community Build. If you have troubles with the automatic connected mode setup, we identified the most common errors in the [#troubleshooting-connected-mode-setup](https://docs.sonarsource.com/sonarqube-for-visual-studio/resources/troubleshooting#troubleshooting-connected-mode-setup "mention") article.
{% hint style="info" %}
Unfortunately, the SonarQube Cloud **Open in IDE** feature is not available for [security-hotspots](https://docs.sonarsource.com/sonarqube-for-visual-studio/using/security-hotspots "mention") at this time when using SonarQube for Visual Studio.
{% endhint %}
## Focusing on new code
The **Focus on New Code** feature works when SonarQube for IDE is running in either connected mode or standalone mode. As mentioned above, new code is defined differently in each mode. Please see the [new-code](https://docs.sonarsource.com/sonarqube-for-visual-studio/using/new-code "mention") page to understand your options when using a New Code Definition.
Setting your focus on new code has these prerequisites running in [connected-mode](https://docs.sonarsource.com/sonarqube-for-visual-studio/connect-your-ide/connected-mode "mention"):
* Your local project must be bound to a SonarQube (Server, Cloud) or SonarQube Community Build project.
* The new code definition must be defined in SonarQube (Server, Cloud) or SonarQube Community Build using a **Previous version**, **Number of days**, or **Specific analysis**.
* The **Reference branch** new code definition is not supported. Please check the server documentation for more details about setting your new code definition:
* [Quality standards and new code](https://app.gitbook.com/s/LWhbesChsC4Yd1BbhHhS/user-guide/about-new-code "mention") in SonarQube Server
* [Quality standards and new code](https://app.gitbook.com/s/B4UT2GNiZKjtxFtcFAL7/standards/about-new-code "mention") in SonarQube Cloud
* [Quality standards and new code](https://app.gitbook.com/s/bqrfLGeD0Y9vE5l9Le42/user-guide/about-new-code "mention") in SonarQube Community Build
Focusing on new code is easy. After setting up connected mode and binding your folder to a project, use one of these methods to activate the **Focus on New Code** feature:
* Select **New code** in the filters of your **Findings** tab.
* Navigate to the **Extensions** > **SonarQube** > **Options** > **General** > **Analysis scope** menu and select **Focus on New Code**.
With **Focus on New Code** deactivated, all issues found in your project will be shown in the same list.
{% hint style="info" %}
When deciding to override a globally defined new code definition at the project level in SonarQube (Server, Cloud) or SonarQube Community Build, note that it is not possible to specify a unique new code definition at the branch level and still activate the **Focus on New Code** mode option.
{% endhint %}
## Viewing AI-generated fix suggestions in the IDE
SonarQube (Server, Cloud) will offer AI-generated fix suggestions for issues detected in your code when AI CodeFix is enabled on your project. You can view the suggestions as a diff view directly in your IDE by selecting **View Fix in IDE** from the **Issues** page in SonarQube (Server, Cloud).
The process is similar to selecting the **Open in IDE** button: it’s best to set up connected mode beforehand. Otherwise, you’ll be prompted to set up a new connection and/or bind your project using the automatic connected mode setup feature.
## The SonarQube tool windows
### SonarQube Report
To open the the **SonarQube Report** tool window, navigate to its default location in the Visual Studio main menu: **Extensions** > **SonarQube** > **View SonarQube Report**.
All issues are available in the **SonarQube Report** tool window. What you see depends on the filters you have active (see [#issues](#issues "mention"), below) and if you’re using [connected-mode](https://docs.sonarsource.com/sonarqube-for-visual-studio/connect-your-ide/connected-mode "mention").
In addition, the **Focus on New Code** feature is available in the **SonarQube Report** tool window; see the [#setting-your-focus-on-new-code](https://docs.sonarsource.com/sonarqube-for-visual-studio/new-code#setting-your-focus-on-new-code "mention") article for details.
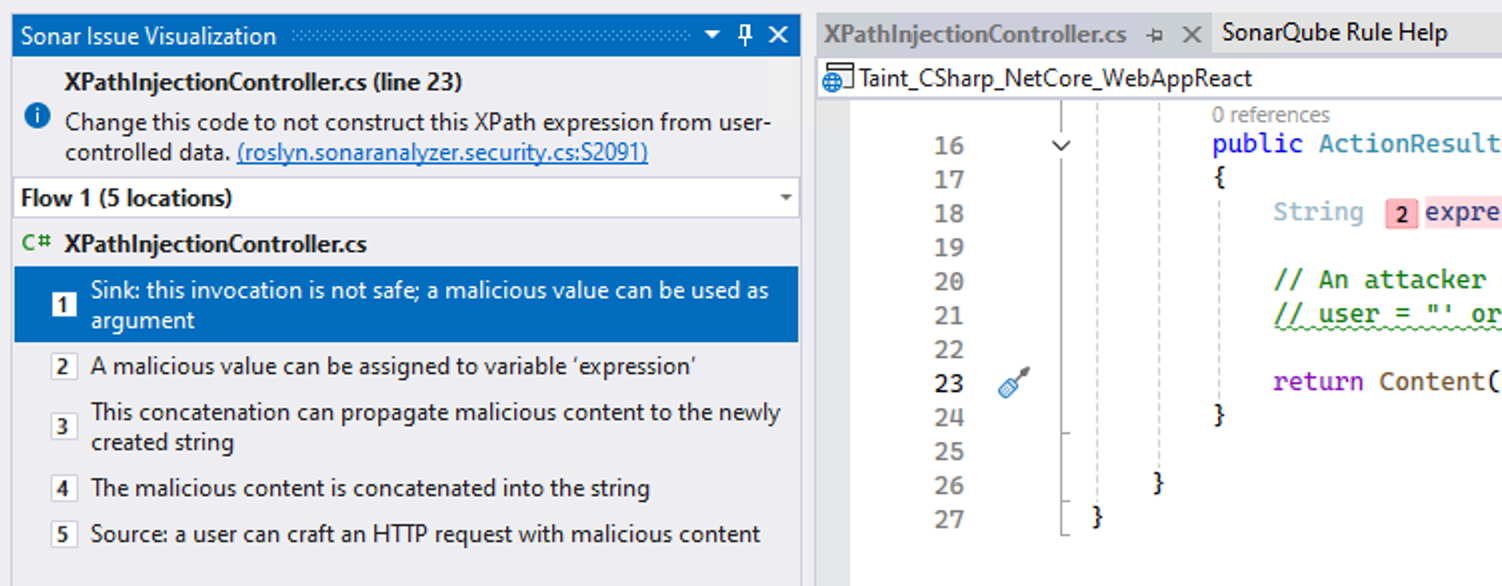
### Sonar Issue Visualization
By default, the Sonar Issue Visualization tool window will be visible in the following cases:
* When an issue with secondary locations is selected in the Error List; for example, the window will automatically appear and disappear as the Error List selection changes.
* For issues with with secondary locations found in the code editor: when selecting the tool-icon and choosing the available action "SonarQube: show issue visualization."
* The **Show Issue Visualization** command is invoked when an issue with secondary locations is selected in the **SonarQube Report** tool window. See the [#visualize-your-issue](https://docs.sonarsource.com/sonarqube-for-visual-studio/taint-vulnerabilities#visualize-your-issue "mention") article for a diagram that shows how SonarQube for IDE displays issues with an injection flow.
**Manually re-opening the SonarQube Issue Visualization tool window**
If you manually close the tool window it will no longer appear and disappear automatically. You can show the window again using one of three menu commands:
* Through the Visual Studio menu bar: **Extensions** > **SonarQube** > **Show Issue Visualization**, which is always available
* Use the tool-icon suggested action **SonarQube: Show Issue Visualization** when hovering over an issue in the Editor
* Selecting an issue with secondary locations in the **SonarQube Report** tool window
Please also read the [#issues-with-secondary-locations-1](#issues-with-secondary-locations-1 "mention") article below to learn how to navigate issues that show in this tool window.
### Sonar Rule Descriptions
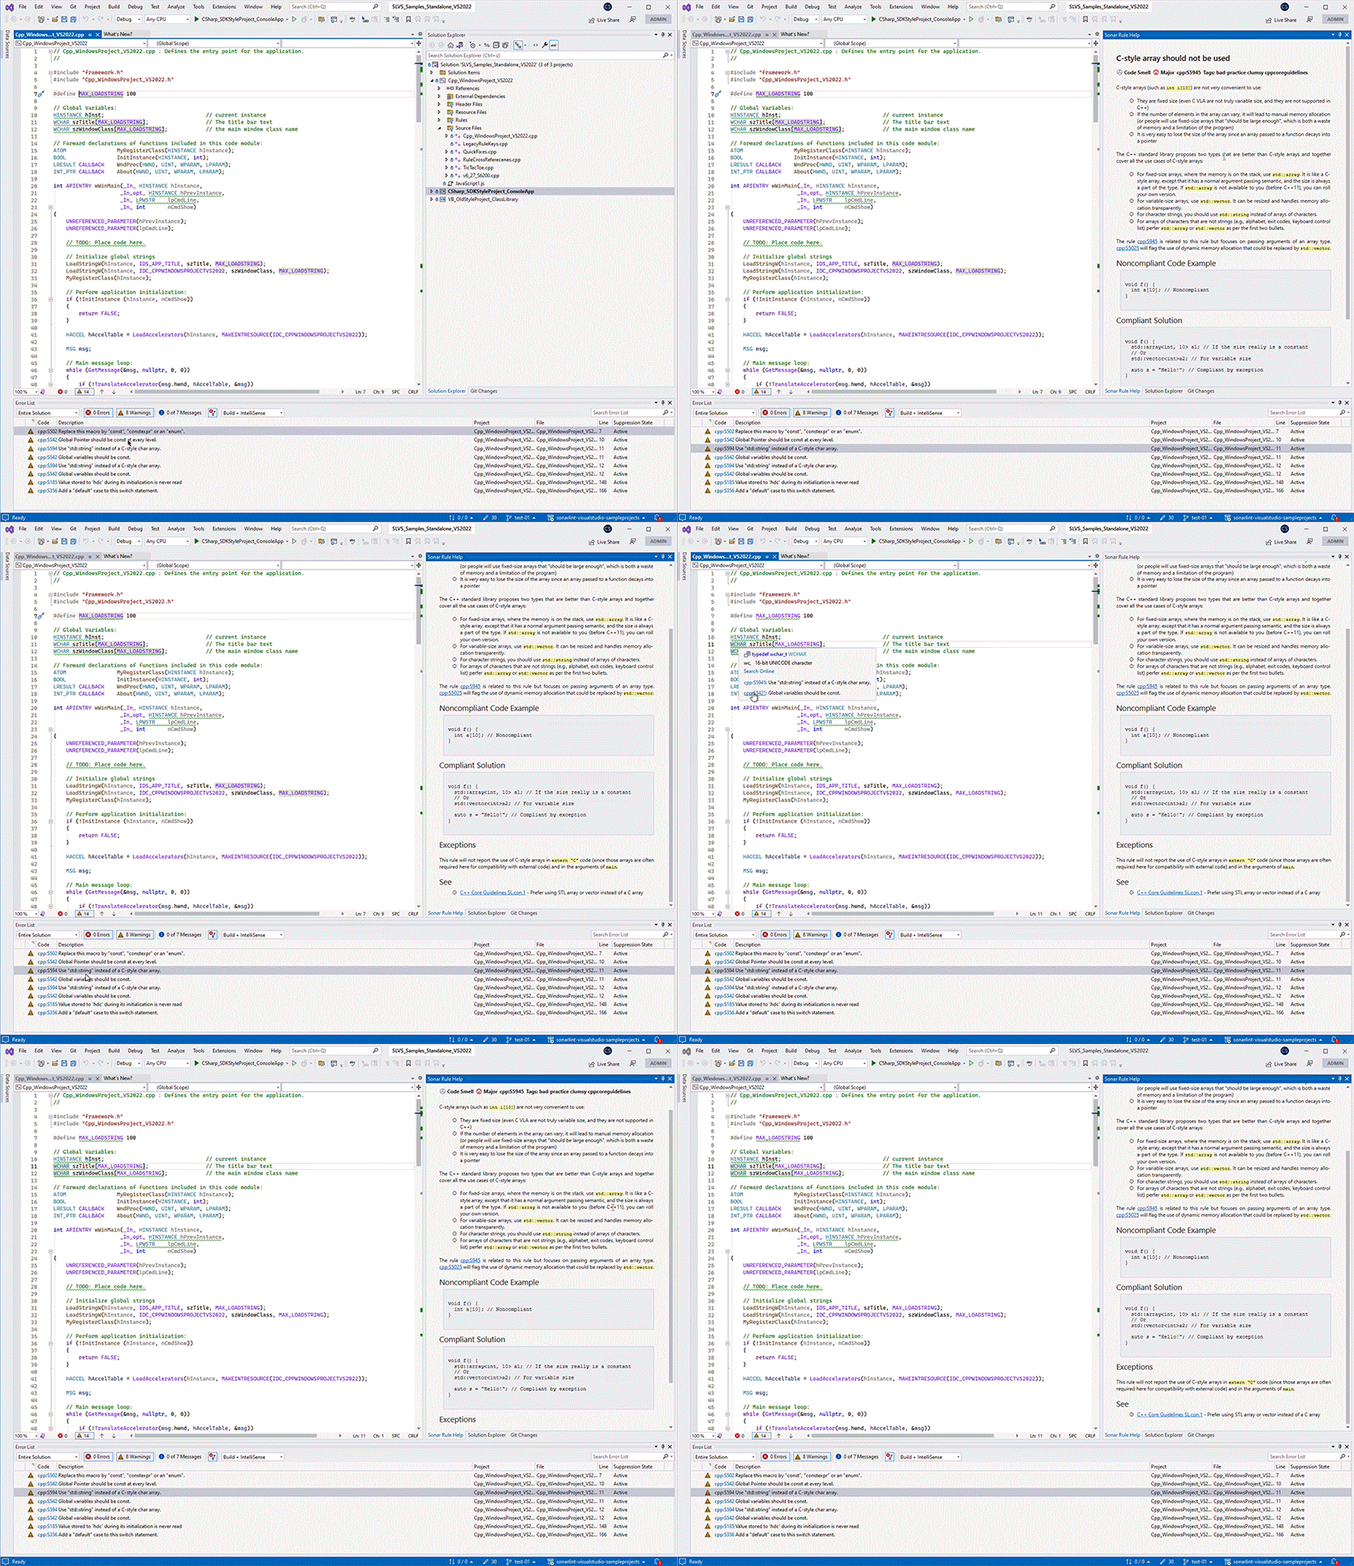
SonarQube for Visual Studio can access descriptive and educational content associated with each issue. Simply select the issue’s rule, as shown below, to open the **SonarQube Rule Help** view and view the rule descriptions.
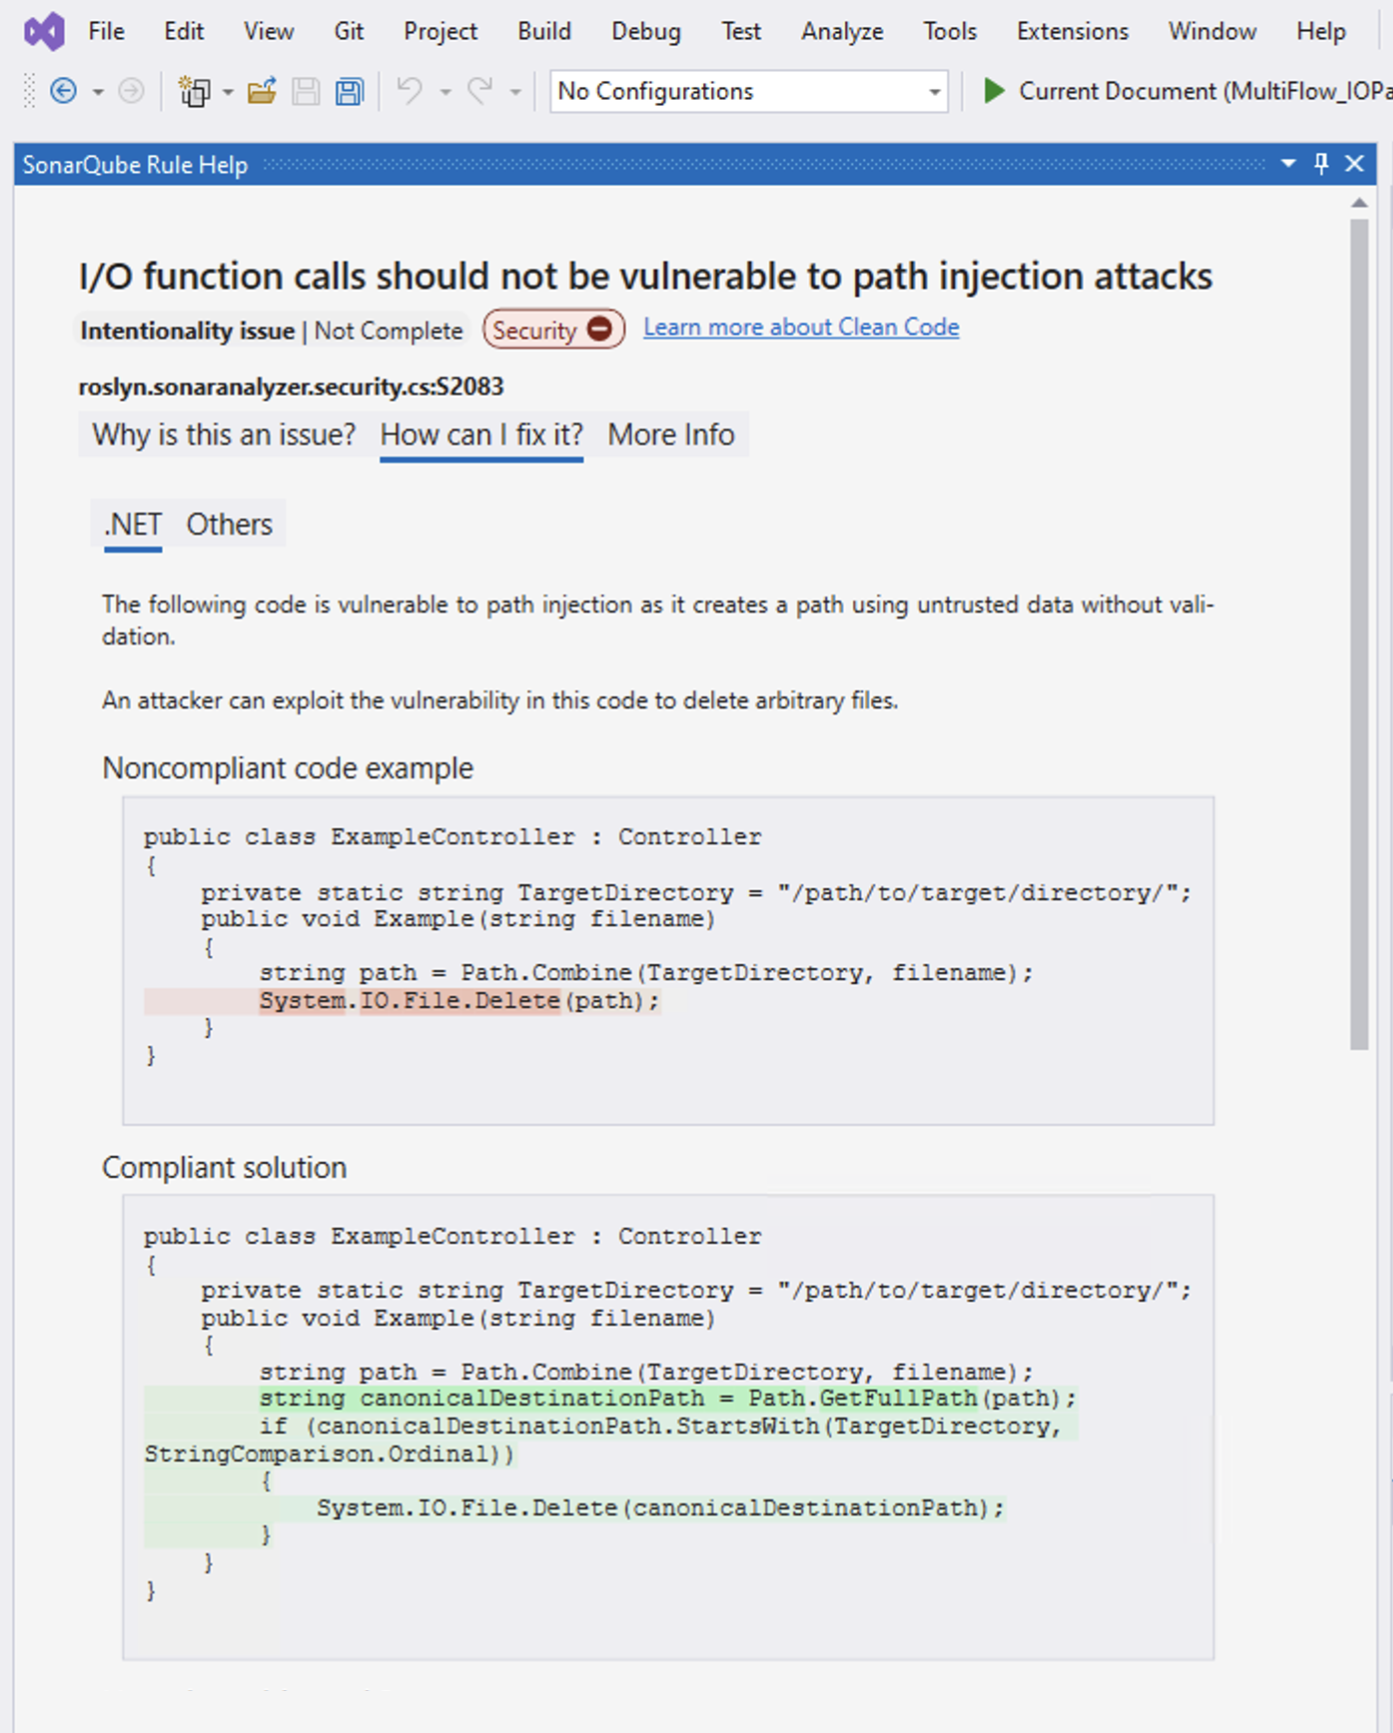
The **SonarQube Rule Help** view brings rule descriptions and patch instructions relevant to the library or framework you’re using, directly into the IDE. The rule descriptions include a brief explanation of the rule as well as Noncompliant and Compliant code samples.
Users can visualize a diff view for the non & compliant code samples, which should help you fix your issue. Note that diff highlighting is only available for rules descriptions migrated to the new format, and we’re progressively migrating all existing rules to the new format.
An issue’s Clean Code attribute, software qualities, and severity are presented to you when opening the **SonarQube Rule Help** view. Below the rule title, you will find the coding attribute labels that highlight an issue’s classification. Check the [glossary](https://docs.sonarsource.com/sonarqube-for-visual-studio/resources/glossary "mention") for details about coding attributes, and the [software-qualities](https://docs.sonarsource.com/sonarqube-for-visual-studio/using/software-qualities "mention") page to better understand how they help classify your issue.
**When in Connected Mode**
If you’re running SonarQube for Visual Studio while in connected mode *with SonarQube Server or SonarQube Community Build*, your view will change according to the server settings. Standard Experience mode encompasses the use of rule types such as bugs, code smells, and vulnerabilities. Alternatively, if SonarQube Server is set to Multi-Quality Rule mode, you will more accurately represent the impact an issue has on all software qualities.
Please see the pages about the MQR mode and Standard Experience for detailed information about the available rule modes for your instance:
* [Choosing a mode for your instance](https://app.gitbook.com/s/LWhbesChsC4Yd1BbhHhS/instance-administration/analysis-functions/instance-mode "mention") in SonarQube Server
* [Choosing a mode for your instance](https://app.gitbook.com/s/bqrfLGeD0Y9vE5l9Le42/instance-administration/analysis-functions/instance-mode "mention") in SonarQube Community Build
## Issue filters
All issues found by SonarQube for Visual Studio can be viewed in the **SonarQube Report** tool window. Issue types include regular **Issues**, **Security hotspots**, and **Taint vulnerabilities**. When you select **Focus on New Code**, new issues introduced since the last server analysis.
Because [connected-mode](https://docs.sonarsource.com/sonarqube-for-visual-studio/connect-your-ide/connected-mode "mention") is required for **Security hotspots** and **Taint vulnerabilities**, they will be greyed out when running in stand alone mode.
In addition, select the **Filters** button to reveal some additional filters that further refine those mentioned above: **Minimum Severity** and your issue's **Status.**
### **Issues**
A SonarQube analysis detects an issue as a problem in your code. When a coding rule is broken, an issue is raised. These issues are summarized under the **Issues** filter. Each issue affects one or more software qualities with a varying impact level, called severity, as inherited from the rule; check the [software-qualities](https://docs.sonarsource.com/sonarqube-for-visual-studio/using/software-qualities "mention") page for more information.
Some issues are more complex than others or present a higher level of security risk. When using SonarQube for Visual Studio in connected mode, these issue types will be listed under the Security Hotspots or Taint Vulnerabilities filter.
## Issues with secondary locations
Please read the [#sonarqube-issue-visualization](#sonarqube-issue-visualization "mention") article above for details about how to visualize issues with secondary locations.
### Feature requirements
* SonarLint version 4.26 or higher.
* Supported languages for in-IDE analysis: C, C++, JavaScript, TypeScript
* Supported languages for [security-hotspots](https://docs.sonarsource.com/sonarqube-for-visual-studio/using/security-hotspots "mention") and [taint-vulnerabilities](https://docs.sonarsource.com/sonarqube-for-visual-studio/using/taint-vulnerabilities "mention"): C, C++, C#, VB.NET
### Feature Overview
All SonarQube for Visual Studio issues specify a location in the code showing where the issue occurs. However, some of the more complex rules produce issues for which a single location is not enough to adequately explain why the issue has occurred. These more complex rules often identify additional locations in the code to help understand the problem. These additional locations are referred to as secondary locations.
For some rules (i.e. cpp:S3529) the secondary locations identify a ‘flow’ through the code that leads to the issue. For other rules (i.e. cpp:S1871), the secondary locations indicate other locations that are related to the issue.
SonarQube for Visual Studio shows these secondary locations in the editor and in a separate tool window.
### Navigating between secondary locations
Selecting a secondary location in the tool window will move the edit cursor to the specified location in the code.
It is also possible to navigate between secondary locations using the keyboard with the following shortcuts:
* Go to next location: Ctrl+Shift+Alt+Q, Ctrl+Shift+Alt+Right Arrow
* Go to previous location: Ctrl+Shift+Alt+Q, Ctrl+Shift+Alt+Left Arrow
These shortcut key combinations were chosen to avoid conflicts with existing Visual Studio shortcuts and shortcuts in popular third-party extensions. As always, it is possible to customize these shortcuts in Visual Studio. See the MS documentation for more information.
**Non-navigable locations**
It is not always possible to navigate to a location in the code; for example, if the code has been changed since the file was analyzed, or the source file has been deleted, the previous destination may no longer exist. In such cases, the Issue Visualization tool window will warn you that some locations cannot be found.
## Known issues
This is a list of known problems with the SonarQube for Visual Studio UI.
**Issue Visualization panel will no longer appear and disappear automatically**
* The panel was likely closed manually and therefore needs to be re-opened manually. See the [#sonarqube-issue-visualization](#sonarqube-issue-visualization "mention") article (above) for information about reopening this tool window.
