Monitoring portfolio metrics
SonarQube offers various tools to monitor and compare code metrics for your portfolio.
Portfolios are available starting in Enterprise Edition.
To view the values of all code metrics in your portfolio:
In the top navigation bar, click Portfolios and then click the portfolio you want to monitor.
In the portfolio navigation bar, click Measures.
To view the value history of one or several code metrics in your portfolio:
1. In the top navigation bar, click Portfolios and then click the portfolio you want to monitor.
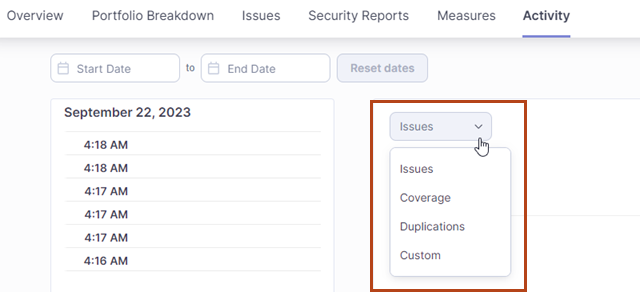
2. In the portfolio navigation bar, click Activity. The number of issues is shown in a graph.
3. To change the metrics shown, click Issues and select another metric category in the drop-down list.

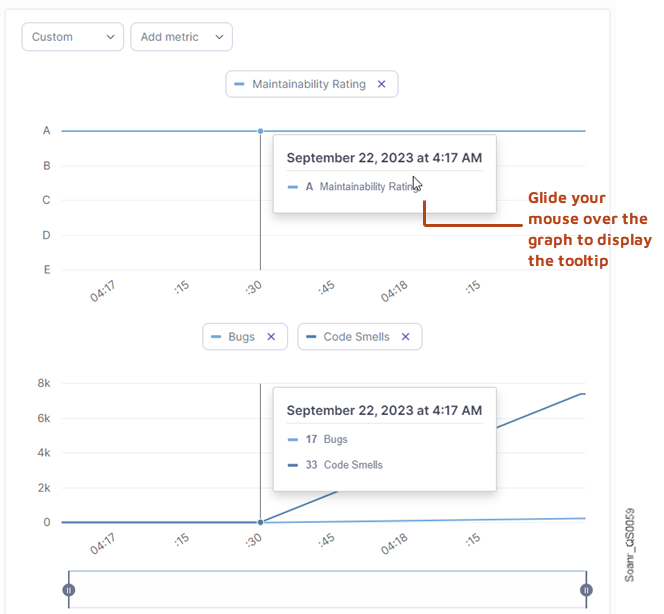
4. Select Custom if you want to monitor other metrics: the Add metric drop-down list is displayed. Then, click Add metric and select in the drop-down list the metric(s) you want to monitor. A graph is displayed for each selected metric so that you can compare them.

Last updated
Was this helpful?