Monitoring portfolio metrics
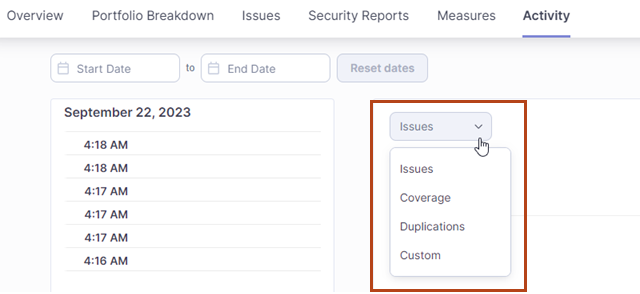
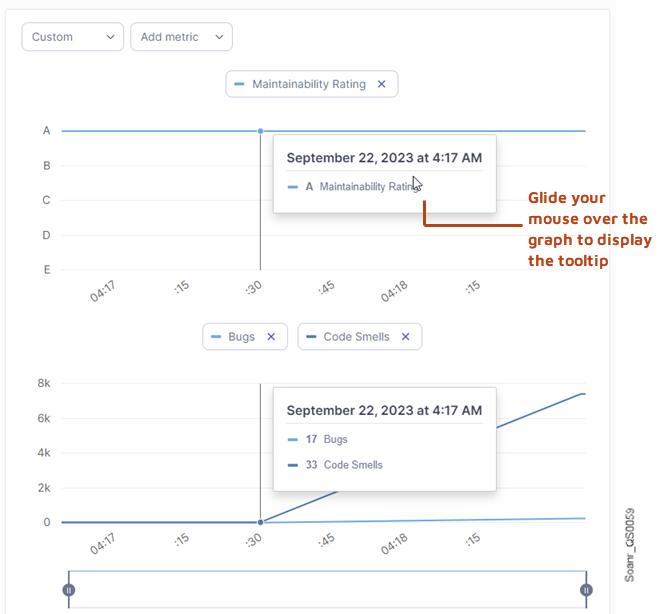
SonarQube offers various tools to monitor and compare code metrics for your portfolio.
Was this helpful?


SonarQube offers various tools to monitor and compare code metrics for your portfolio.
Was this helpful?
Was this helpful?